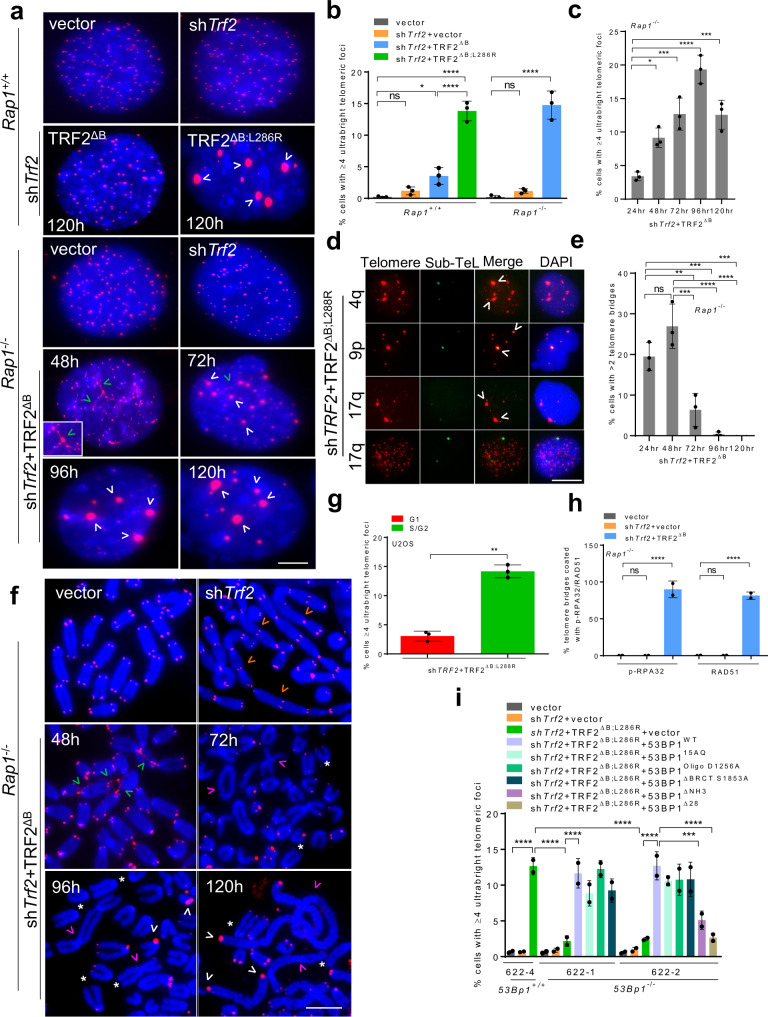
Fig. 1. TRF2B and RAP1 cooperate to repress ultrabright telomere formation.
a PNA- FISH of interphase nuclei showing time-dependent increase of CCCTAA-positive telomere filaments (green arrowheads) and UT foci (white arrowheads) in Rap1+/+ and Rap1–/– MEFs expressing the indicated DNAs. CCCTAA-positive filaments and telomeres detected with TelC-Cy3 (CCCTAA)3 PNA telomere probe (red) and DAPI to stain nuclei (blue). Inset: magnified view of CCCTAA-positive filaments and UTs. Scale bars: 5 µm. b Quantification of UTs in Rap1+/+ and Rap1–/– MEFs after 120 hrs. The mean of three independent experiments ± SD are shown, at least 200 nuclei analyzed per experiment. *P = 0.0458, ****P < 0.0001 by one-way ANOVA. ns: non-significant. c Quantification of UTs in Rap1–/– MEFs expressing TRF2ΔB at the indicated time points. The mean of three independent experiments ± SD are shown, at least 250 nuclei analyzed per experiment. *P = 0.0240, ***P = 0.0010, ****P < 0.0001 by one-way ANOVA. ns non-significant. d Representative images of UTs from two independent experiments shown to co-localized (white arrowheads) with indicated chromosomal specific sub-telomere probes (green) in U2OS cells expressing TRF2∆B;L288R. Scale bars: 5 µm. e Quantification of CCCTAA-positive filaments in Rap1–/– MEFs expressing TRF2ΔB at the indicated time points. The mean of three independent experiments ± SD are shown; at least 250 nuclei analyzed per experiment. **P = 0.0060, ***P = 0.0003, ****P < 0.0001 by one-way ANOVA. ns non-significant. f Representative PNA-FISH on metaphase spreads of Rap1–/– MEFs expressing TRF2ΔB from three independent experiments showing maximum formation of CCCTAA-positive telomere filaments (red) at 48 hrs (green arrowheads), UTs (white arrowheads), signal free ends (*), chromosomes fused with telomeres (orange arrowheads), chromosomes fused without telomeres (pink arrowheads). A minimum of 35 metaphase for each sample were examined per experiment. Scale bars: 15 µm. g The Fucci assay showing UTs formed primarily during the S-phase in U2OS cells. The mean of three independent experiments ±SD are shown, at least 150 nuclei analyzed per experiment. **P = 0.0015 by two-tailed unpaired t test. h Quantification of p-RPA32 and RAD51 localization on telomere bridges in Rap1–/– MEFs expressing indicated DNA constructs after 48 h. The mean of two independent experiments ± SD are shown, at least 200 nuclei analyzed per experiment. ****P < 0.0001 by one-way ANOVA. ns non-significant. i Quantification of UT frequencies in 53Bp1+/+ and 53Bp1–/– MEFs reconstituted with WT 53BP1 and the indicated 53BP1 mutants in the presence of shTrf2 + TRF2ΔB;L286R. The mean of two independent experiments ± SD are shown, at least 150 nuclei analyzed per experiment. ***P = 0.0010, ****P < 0.0001 by one-way ANOVA. Source data are provided as a Source Data file.

