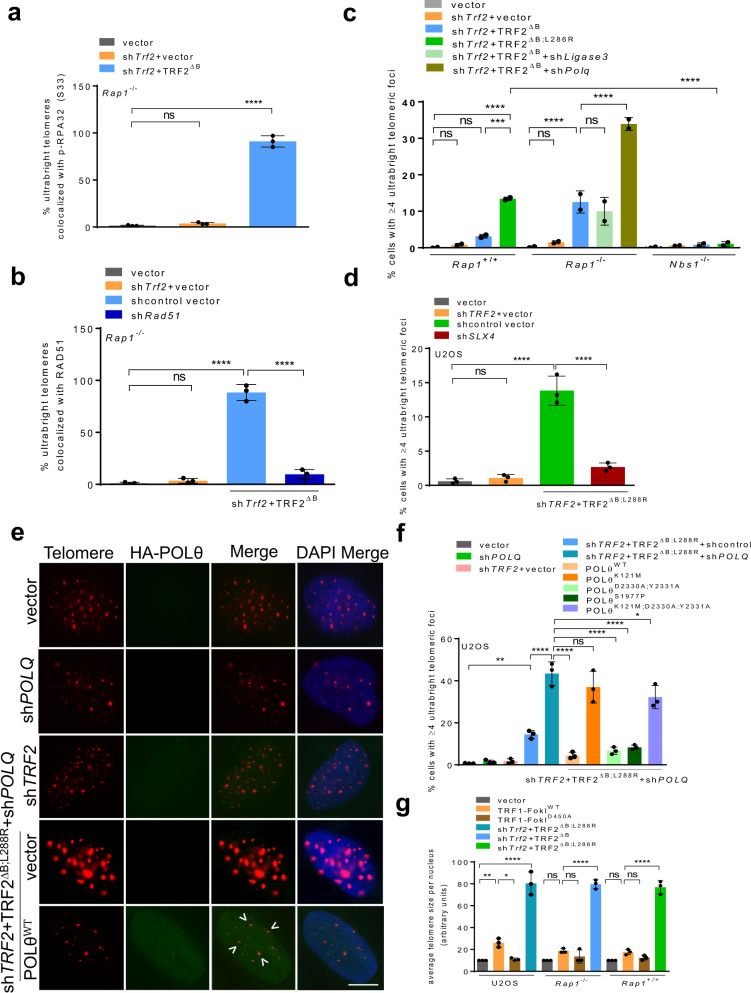
Fig. 2. Recruitment of HDR factors promote the formation of ultrabright telomeres.
a Quantification of percent UTs co-localized with p-RPA32 (S33) in Rap1−/− MEFs expressing TRF2∆B. Data represents the mean of three independent experiments ± SD from a minimum 200 nuclei analyzed per experiment. ****P < 0.0001 by one-way ANOVA. ns non-significant. b Quantification of percent UTs co-localized with RAD51 in Rap1−/− MEFs expressing TRF2∆B. Data represents the mean of three independent experiments. At least 200 nuclei were examined per experiment. ****P < 0.0001 by one-way ANOVA. ns non-significant. c Quantification of UT frequencies in the absence of NBS1 and Ligase 3 that promote A-NHEJ. Data represents the mean values from two independent experiments ± SD from a minimum 200 nuclei analyzed per experiment. ***P = 0.0005, ****P < 0.0001 by one-way ANOVA. ns non-significant. d Quantification of the percentage of U2OS cells possessing UTs with or without treatment with SLX4 shRNA. Data represents the mean of three independent experiments ± SD from a minimum 200 nuclei analyzed per experiment. ****P < 0.0001 by one-way ANOVA. ns non-significant. e IF-FISH for HA-POLθ (green) co-localizing with telomeres (red) in U2OS cells expressing TRF2ΔB,L288R. Scale bars: 5 µm. f Quantification of UTs in U2OS cells expressing the indicated DNA constructs. Data represents the mean of three independent experiments ±SD from a minimum 150 nuclei analyzed per experiment. *P = 0.0295, **P = 0.0051, ****P < 0.0001 by one-way ANOVA. ns non-significant. g Quantification showing average telomere size per nucleus in U2OS, Rap1–/– and Rap1+/+ MEFs expressing indicated DNA constructs. Data represents the mean of three independent experiments ±SD from a minimum 100 nuclei analyzed per experiment. *P = 0.01, **P = 0.0064, ****P < 0.0001 by one-way ANOVA. ns non-significant. Source data are provided as a Source Data file.

