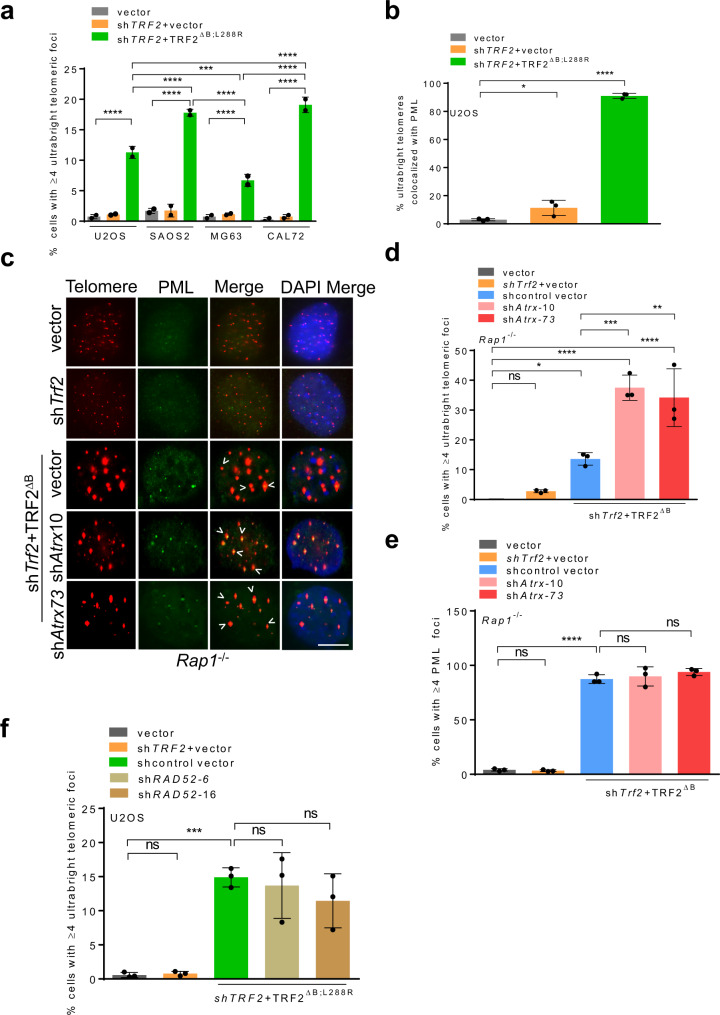
Fig. 3. TRF2B and RAP1 repress ALT associated proteins at telomeres.
a Quantification of UT frequencies in ATRX-positive and ATRX-null ALT cells expressing indicated DNA constructs. Data represents the mean of two independent experiments ±SD from a minimum 200 nuclei analyzed per experiment. ***P = 0.0009, ****P < 0.0001 by one-way ANOVA. b Quantification of percent UTs co-localized to PML bodies in U2OS expressing shTRF2 + TRF2ΔB;L288R. Data represents the mean of three independent experiments ±SD from a minimum 150 nuclei analyzed per experiment. *P = 0.0460, ****P < 0.0001 by one-way ANOVA. c Representative IF-FISH images showing the loss of ATRX promotes the formation of UTs colocalized with PML (green) in Rap1–/– MEFs expressing TRF2ΔB. Scale bars: 5 µm. d Quantification of cells containing ≥4 UTs with or without Atrx shRNAs in (c). Data represents the mean of three independent experiments ± SD from a minimum 250 nuclei analyzed per experiment. *P = 0.0407, **P = 0.0028, ***P = 0.0009, ***P < 0.0001 by one-way ANOVA. ns: non-significant. e Quantification of percent UTs co-localized to PML bodies in (c). Data represents the mean of three independent experiments ± SD from a minimum 250 nuclei analyzed per experiment. ****P < 0.0001 by one-way ANOVA. ns non-significant. f Quantification of cells containing ≥4 UTs with or without RAD52 shRNAs. The mean of three independent experiments ± SD shown from a minimum 200 nuclei analyzed per experiment. ***=0.0008 by one-way ANOVA. ns non-significant. Source data are provided as a Source Data file.

