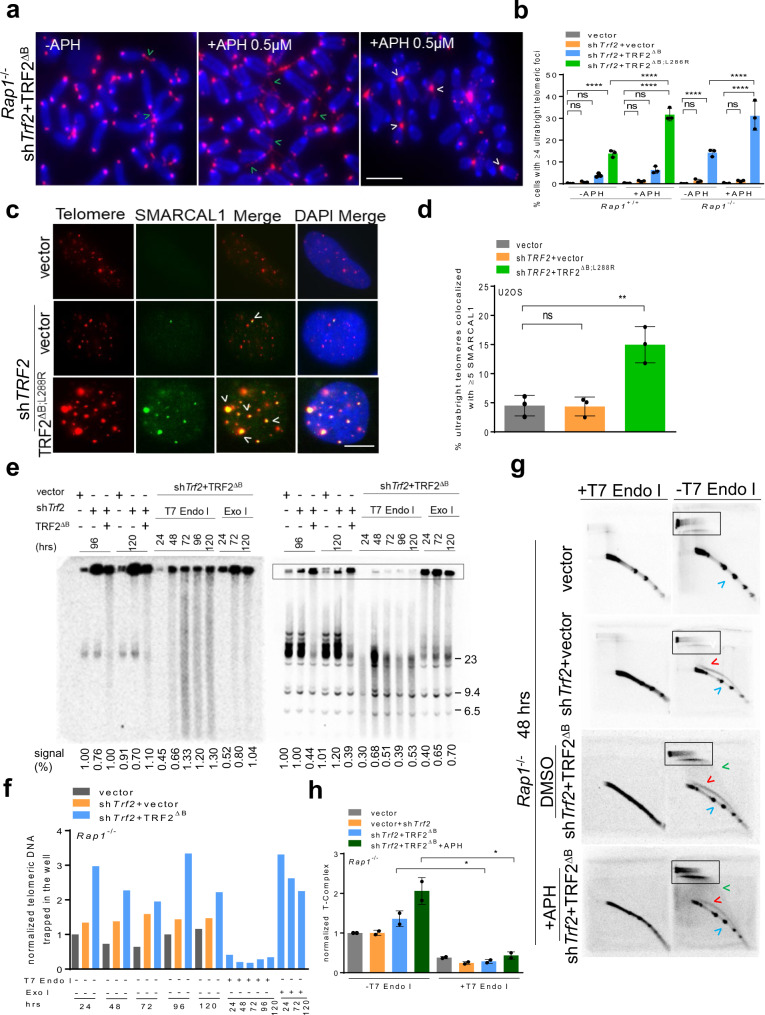
Fig. 4. Replication defect is an early step in ultrabright telomere formation.
a PNA-FISH on metaphase spreads showing CCCTAA-positive filaments (green arrowheads) and UTs (white arrowheads) in Rap1–/– MEFs expressing TRF2ΔB with + /– 0.5 µM aphidicolin (APH) treatment. Scale bars: 20 µm. A minimum of 30 metaphases for each sample were examined per experiment. b Quantification of UT frequencies in the interphase nuclei of Rap1+/+ and Rap1–/– MEFs expressing the indicated DNA constructs in (a). Mean of three independent experiments ± SD are shown from a minimum 250 nuclei analyzed per experiment. ****P < 0.0001 by one-way ANOVA. ns non-significant. c Representative IF-FISH images showing UTs co-localized to SMARCAL1 (green) in U2OS cells expressing shTRF2 + TRF2ΔB;L288R. Scale bars: 5 µm. d Quantification of percent UTs colocalized with SMARCAL1 in (c). Mean of three independent experiments ± SD from a minimum 300 nuclei analyzed per experiment. **P = 0.0032 by one-way ANOVA. ns non-significant. e In-gel single-strand G overhang (native, left panel) and total telomere (denatured, right panel) analysis in Rap1–/– MEFs expressing the indicated cDNA constructs at the indicated time point with ±T7 endonuclease I (T7 Endo I) and Exo I treatment. Single-strand G overhang and total telomere signals in vector was set at 100% after normalizing each lane with ethidium bromide staining that served as an internal loading control. The numbers below the gel represents single-strand G overhang and total telomere signals. Molecular weights are displayed on the right. f Quantification of normalized telomeric DNA trapped in the well (outlined by the box) at indicated time point in (e) from one representative experiment (see also Supplementary Fig. 4f). Signal intensities in vector was set at 100% after normalizing with sub telomeres signals that served as an internal loading control. g T-complex and T-circle analysis using two-dimensional (2D) gel electrophoresis from genomic DNA isolated from Rap1–/– MEFs expressing the indicated DNA constructs in ±0.5 µM APH treated with 40 units of T7 endonuclease I. T-complex (outlined by the box), t-circle (green arrowheads), ss G (red arrowheads), ds TRF (blue arrowheads). h Quantification of T-complex in (g). T-complex signal intensities in vector was set at 100% after normalizing with sub telomeres signals that served as an internal loading control. The graph represents the mean ± SD from two independent experiments. *P = 0.0175 by two tailed unpaired t test. Source data are provided as a Source Data file.

