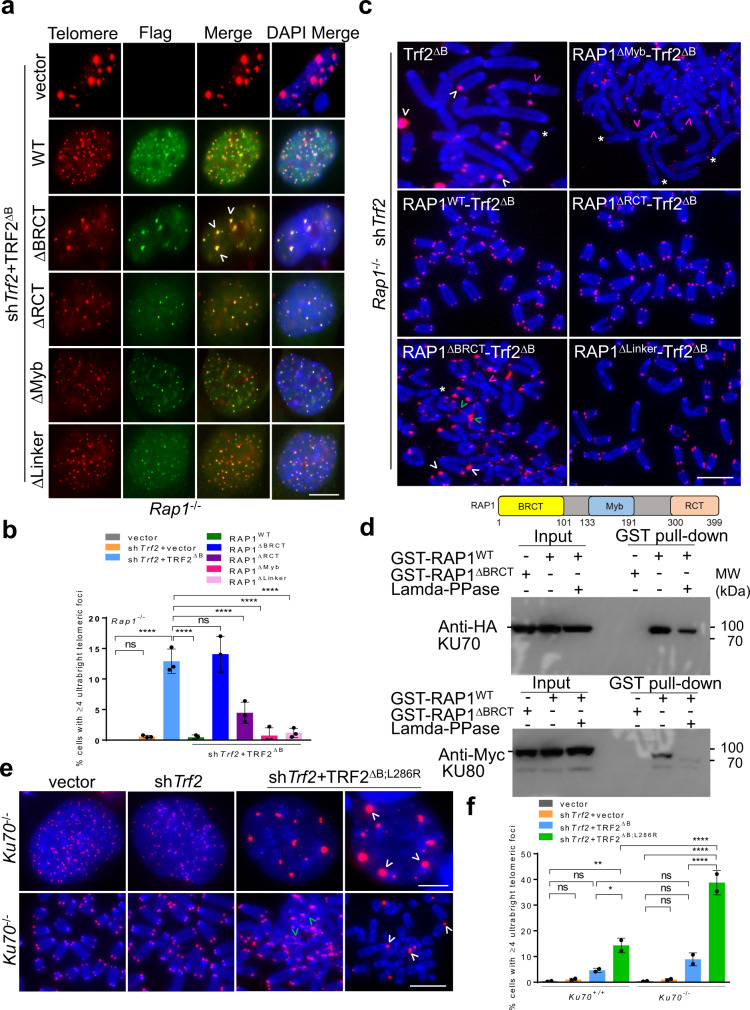
Fig. 6. RAP1 BRCT domain and KU70/KU80 cooperate to repress ultrabright telomeres.
a IF-FISH showing Flag-tagged RAP1-TRF2ΔB fusion protein (green) localization at UTs in Rap1–/– MEFs expressing indicated constructs. Scale bars: 5 µm. b Quantification of UT frequencies in (a). Data shown as the mean of three independent experiments ± SD from a minimum 200 nuclei analyzed per experiment. ****P < 0.0001 by one-way ANOVA. ns non-significant. c Representative images from three independent experiments of PNA-FISH on metaphase spreads showing CCCTAA-positive filaments (green arrowheads) and UTs (white arrowheads), signal free ends (*), fused chromosome without telomere at the fusion site (pink arrowheads) in Rap1–/– MEFs expressing Flag-tagged RAP1-TRF2ΔB fusion proteins. At least 30 metaphases were analyzed per experiments. Scale bars: 15 µm. d Purified GST-RAP1WT and GST-RAP1∆BRCT were subjected to a pull-down assay with 293 T cell lysates overexpressing HA-KU70 and Myc-KU80 in the presence and absence of lambda -PPase (protein phosphatase). The blot shown is the representative of two independent experiments. e PNA-FISH on interphase nuclei and metaphases showing the formation of CCCTAA-positive filaments (green arrowheads) and UTs (white arrowheads) in Ku70–/– MEFs expressing indicated constructs. Scale bars: 5 µm. f Quantification of UT frequencies in (e). Data shown as the mean of two independent experiments ±SD from a minimum 350 nuclei analyzed per experiment. *P = 0.0277, **P = 0.0030, ****P < 0.0001 by one-way ANOVA. ns non-significant. Source data are provided as a Source Data file.

