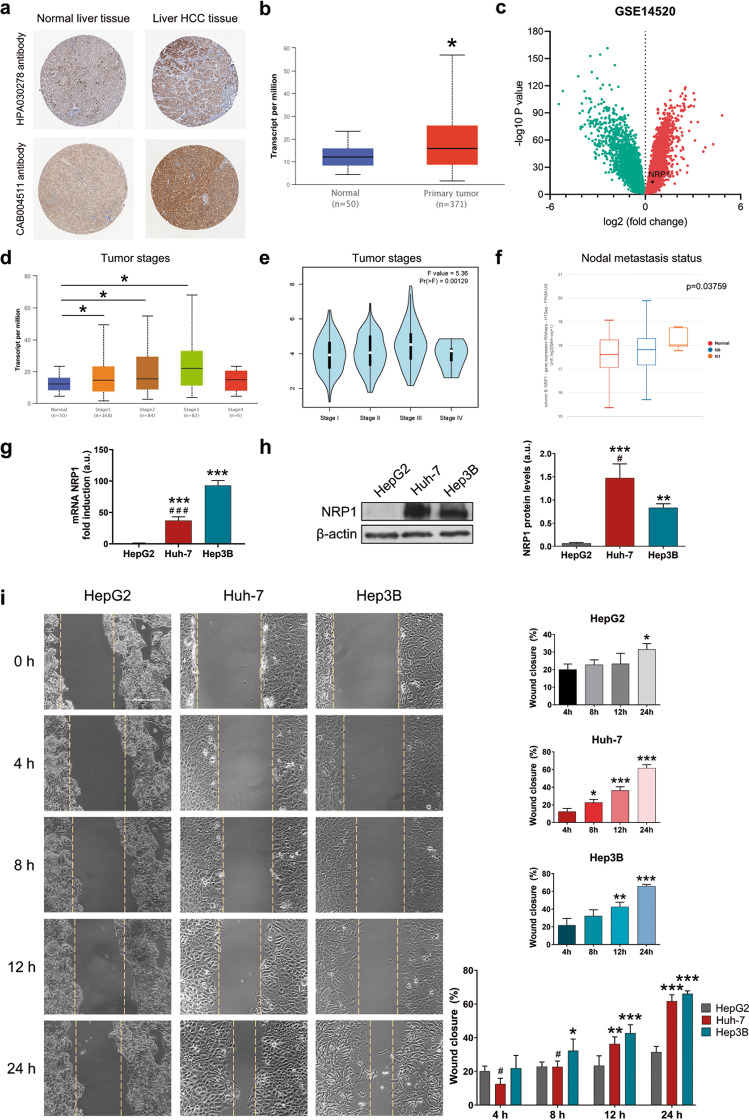
Fig. 1. Characterization of NRP1 expression in human samples and HCC cell lines, and cell migration ability.
Representative images of NRP1 immunohistochemistry in normal liver and HCC tissues from the (a) HPA database and comparative analysis of NRP1 expression levels obtained from the (b) UALCAN database employing the TCGA gene datasets. Identification of significantly downregulated (green) or upregulated (red) expressed genes in HCC GSE14520 dataset from the (c) GEO database. Association of NRP1 levels with tumor stages from the (d) UALCAN and (e) GEPIA databases, and with different nodal metastasis status from the (f) UCSC Xena database. Significant differences when *P < 0.05. Comparison of the (g) mRNA and (h) protein levels of NRP1 determined in the three HCC cell lines HepG2, Huh-7 and Hep3B by qRT-PCR and Western blot, respectively. A representative immunoblot for each protein with the quantification of the corresponding triplicates is shown. Data are expressed as mean values of arbitrary units (a.u.) ± SD (n = 3). *P < 0.05, **P < 0.01, ***P < 0.001 vs HepG2; #P < 0.05 vs Hep3B. i Cell migration ability was evaluated by wound-healing assay, representing the % of the wound closure area after 4, 8, 12 and 24 h from the scratch, separately for each cell line and comparing the three HCC lines. Magnification 10×, scale bar 50 µm. For each cell line analysis *P < 0.05, **P < 0.01, ***P < 0.001 vs 4 h. For comparison analysis of the three cell lines *P < 0.05, **P < 0.01, ***P < 0.001 vs HepG2; #P < 0.05 vs Hep3B.

