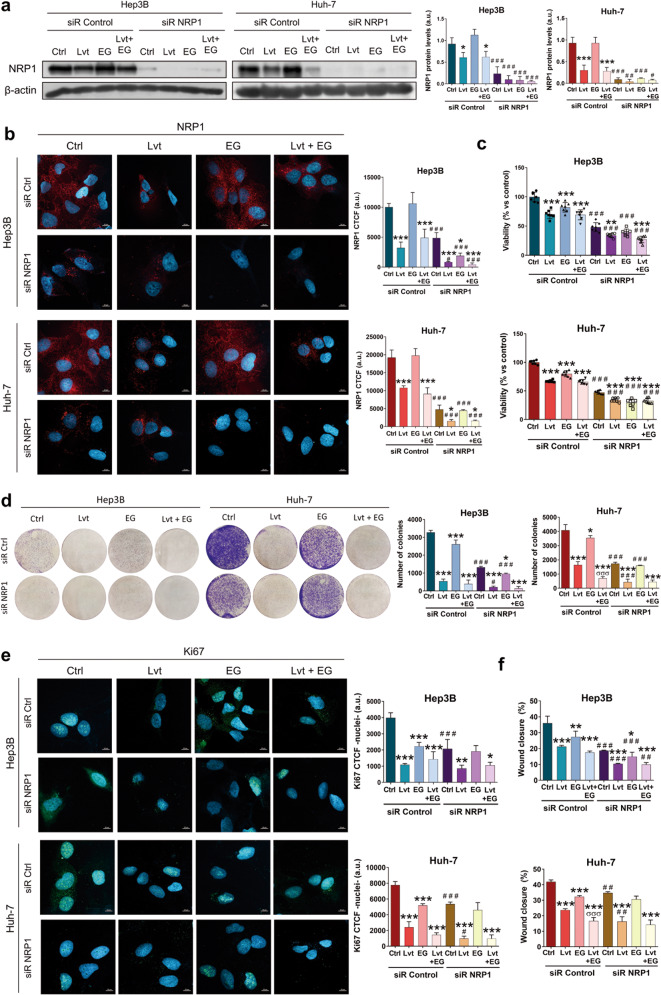
Fig. 3. Effects of targeting NRP1 on lenvatinib actions on cell proliferation and cell migration ability.
All the assays were performed 48 h post-silencing with the last 24 h of treatment with 2.5 µM lenvatinib (Lvt) and/or 15 µM EG00229 (EG). Protein levels of NRP1 were analyzed by (a) Western blot and (b) ICC, and cell viability was assessed by (c) CellTiter-Glo®, (d) colony formation assays, and (e) nuclear translocation of Ki67 by ICC and confocal microscopy. Data from (c) are represented as % of mean values relative to control (Ctrl) ± SD (n = 7). Data from (a), (b), (d) and (e) are represented as mean values of arbitrary units (a.u.) ± SD (n = 3). a A representative immunoblot is shown. Bar graphs from (b) and (e) represent the NRP1 CTCF ratio and nuclear CTCF ratio of Ki67, respectively. Magnification 63×, scale bar 10 µm. f Cell migration was evaluated by wound-healing assay, representing the % of the wound closure area after 24 h from the scratch. *P < 0.05, **P < 0.01, ***P < 0.001 vs non-treated cells in each siR group; #P < 0.05, ##P < 0.01, ###P < 0.001 vs siR control; σσσP < 0.001 Lvt+EG vs Lvt treatment.

