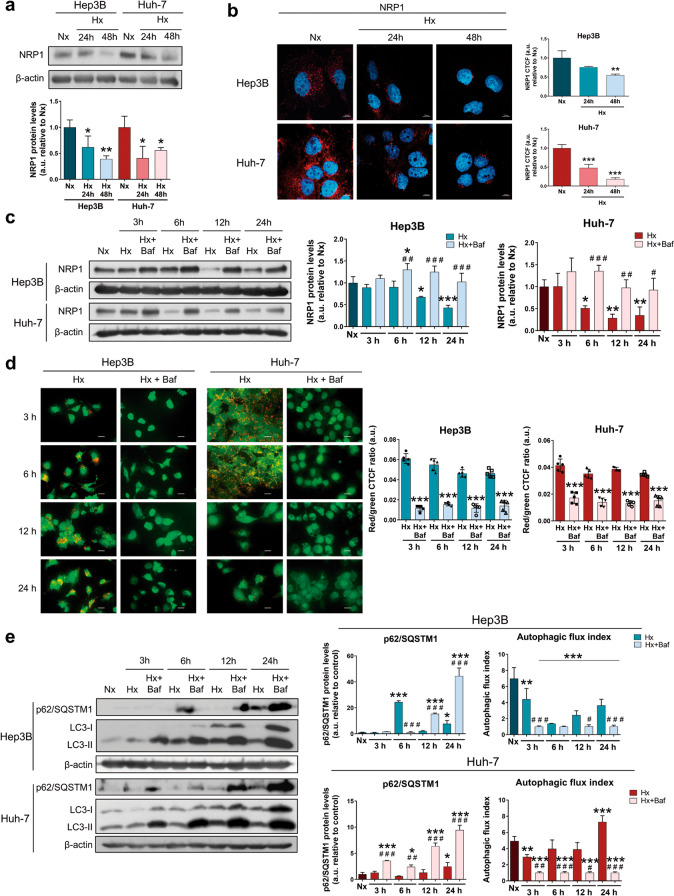
Fig. 6. Analysis of the modulation on NRP1 protein levels by an in vitro hypoxic microenvironment.
Hypoxia (Hx) was induced by incubating HCC cell lines with 100 µM CoCl2 for the corresponding period of times. Protein expression of NRP1 was analyzed by (a) Western blot and (b) ICC. Bar graphs from (b) represent the NRP1 CTCF ratio. Magnification 63× and scale bar 10 µm. *P < 0.05, **P < 0.01, ***P < 0.001 vs normoxia (Nx). c NRP1 expression was also determined by Western blot in normoxia (Nx) and after hypoxia induction and/or autophagy inhibition by treatment with 100 nM bafilomycin A1 (Baf). *P < 0.05, **P < 0.01, ***P < 0.001 vs Nx; #P < 0.05, ##P < 0.01, ###P < 0.001 Hx+Baf vs Hx for each time point. d Autophagy was evaluated through analysis of autolysosome cell content by acridine orange staining and fluorescence microscopy. Magnification 40×, scale bar 25 µm. Bar graphs represent the quantification of red/green CTCF ratio (n = 5). ***P < 0.001 vs Hx for each time point. e Protein levels of p62/SQSTM1 and LC3 (LC3-I and LC3-II) were analyzed by Western blot. LC3 turnover assay was performed to determine the autophagic flux index. *P < 0.05, **P < 0.01, ***P < 0.001 vs Nx; #P < 0.05, ##P < 0.01, ###P < 0.001 Hx+Baf vs Hx for each time point. Data from (a), (b), (c) and (e) are represented as mean values of arbitrary units (a.u.) ± SD (n = 3), showing a representative immunoblot.

