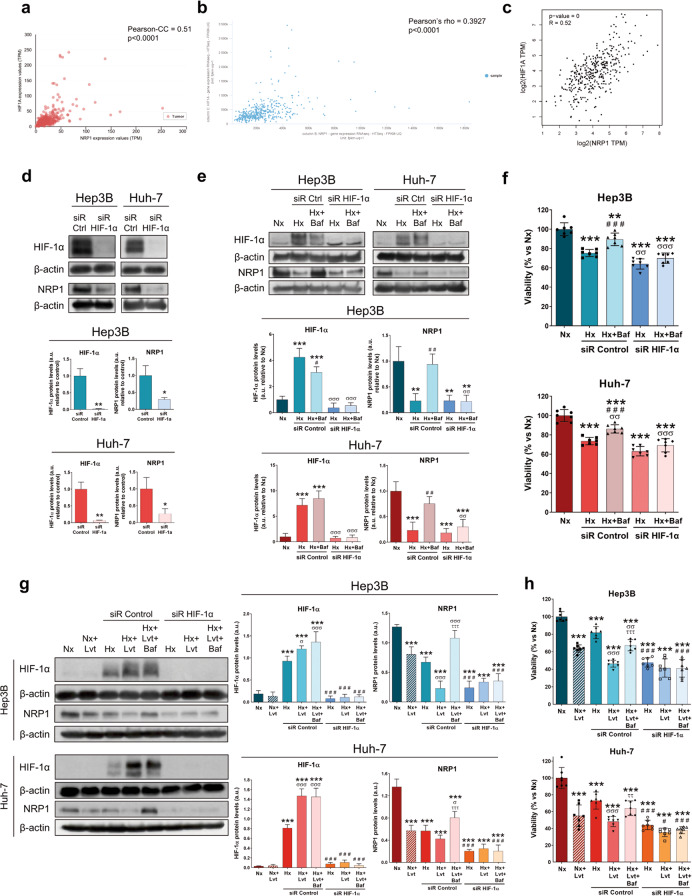
Fig. 7. Study of the HIF-1α-dependent modulation of NRP1 expression and its role on the autophagy-derived regulation of the hypoxia response and the loss of lenvatinib efficacy.
Plots of gene expression correlation between NRP1 and HIF-1α are shown, with the corresponding correlation coefficients and p-values obtained from the (a) UALCAN, (b) UCSC Xena and (c) GEPIA databases. All the following assays were performed 48 h post-silencing with the last 24 h of treatment with 100 µM CoCl2 to induce hypoxia (Hx), 100 nM bafilomycin A1 (Baf) and/or 2.5 µM lenvatinib (Lvt) in both HCC cell lines Hep3B and Huh-7. Protein expression was analyzed by Western blot and cell viability by MTT assay. d Protein levels of HIF-1α and NRP1 after HIF-1α silencing in hypoxia. *P < 0.05, **P < 0.01 vs siR Control. e Protein levels of HIF-1α and NRP1 and (f) cell viability after HIF-1α silencing under hypoxia and in combination with bafilomycin A1. **P < 0.01, ***P < 0.001 vs Nx; ##P < 0.01, ###P < 0.001 vs Hx; σσP < 0.01, σσσP < 0.001 vs siR Control. g Protein levels of HIF-1α and NRP1 and (h) cell viability after HIF-1α silencing under hypoxia and in combination with lenvatinib and/or bafilomycin A1. ***P < 0.001 vs Nx; #P < 0.05, ###P < 0.001 vs siR Control; σP < 0.05, σσP < 0.01, σσσP < 0.001 Hx+Lvt vs Hx; ττP < 0.01, τττP < 0.001 Hx+Lvt+Baf vs Hx+Lvt. Data from (d), (e) and (g) are represented as mean values of arbitrary units (a.u.) ± SD (n = 3), showing one representative immunoblot. Data from (f) and (h) are represented as % of mean values relative to normoxia (Nx) ± SD (n = 7).

