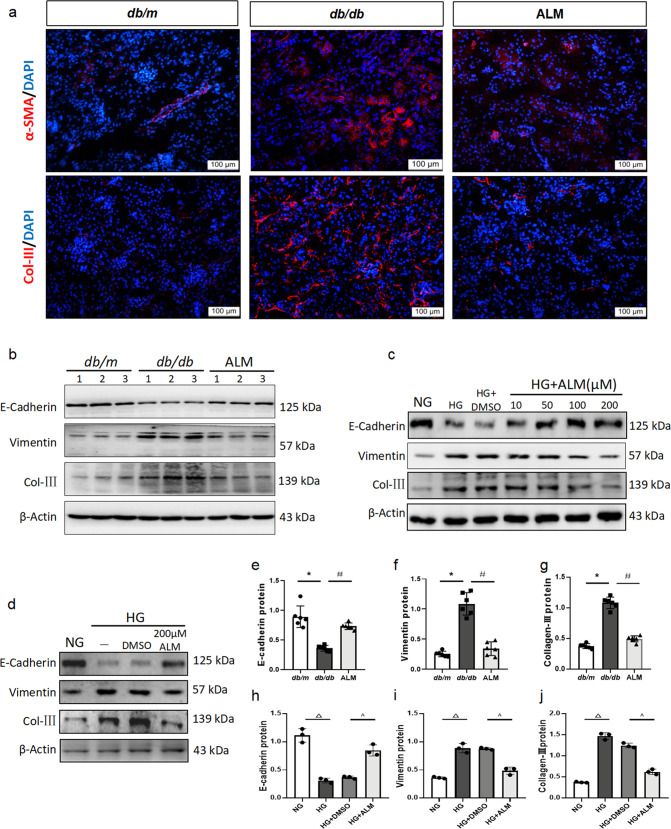
Fig. 2. ALM intervention reduced renal fibrosis.
a Immunofluorescence staining of α-SMA, Col-III expression changes (scale bar, 100 μm). Immunoblot bands (b) and quantitative data (e–g) of E-cadherin, Col-III, and Vimentin in each group of mice. (c) Different concentrations of ALM with high glucose intervened in renal tubular epithelial cells. Immunoblot bands (d) and quantitative data (h–j) of E-cadherin, Col-III, and Vimentin in each group of cells. NG normal glucose (5.5 mmol/L). HG high glucose(35 mmol/L); HG + DMSO: (solvent control group), ALM ALM intervention group (200 μmol/L). Animal experiments: n = 6; *P < 0.05 vs. db/m group. #P < 0.05 vs. db/db group. Cell experiments: △P < 0.05 vs. NG group. ^P < 0.05 vs. HG + DMSO group. All cell data are mean ± SD from three independent experiments.

