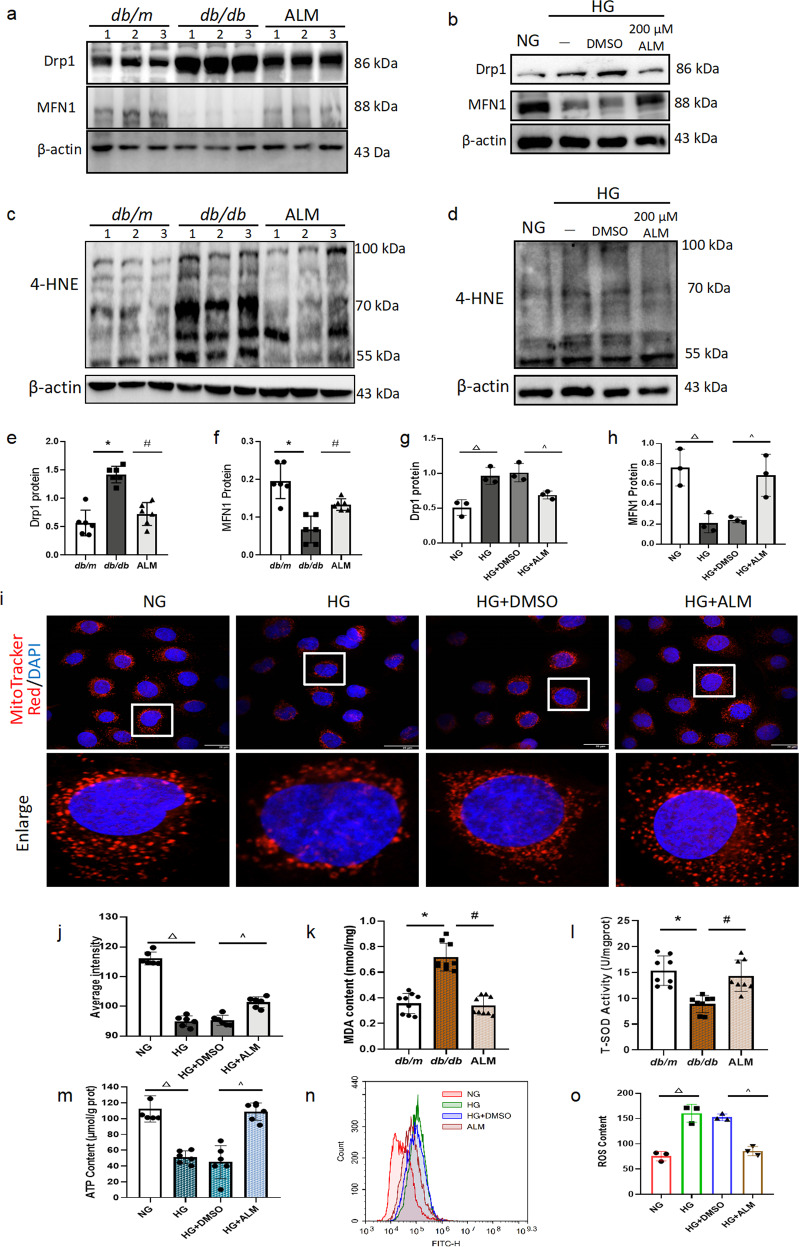
Fig. 3. ALM ameliorated mitochondrial dysfunction in renal tubular epithelial cells of db/db mice.
Detection of changes in mitochondria-related indicators. Immunoblot bands (a–d) and quantitative analysis (e–h) of Drp1, MFN1 and 4-HNE in different groups in vivo and in vitro. Representative confocal microscopy images of mitochondrial morphology stained by MitoTracker Red Staining (i) (scale bar, 20 μm) and quantitative analysis (j). Malondialdehyde(MDA) content (k) and total superoxide dismutase (T-SOD) content (l) measured in the kidney tissues of each group. ATP (m) as well as ROS content (n) and quantitative analysis (o) in the cells of each group. Animal experiments: n = 6; *P < 0.05 vs. db/m group. #P < 0.05 vs. db/db group. Cell experiments: △P < 0.05 vs. NG group. ^P < 0.05 vs. HG + DMSO group. All cell data are mean ± SD from three independent experiments.

