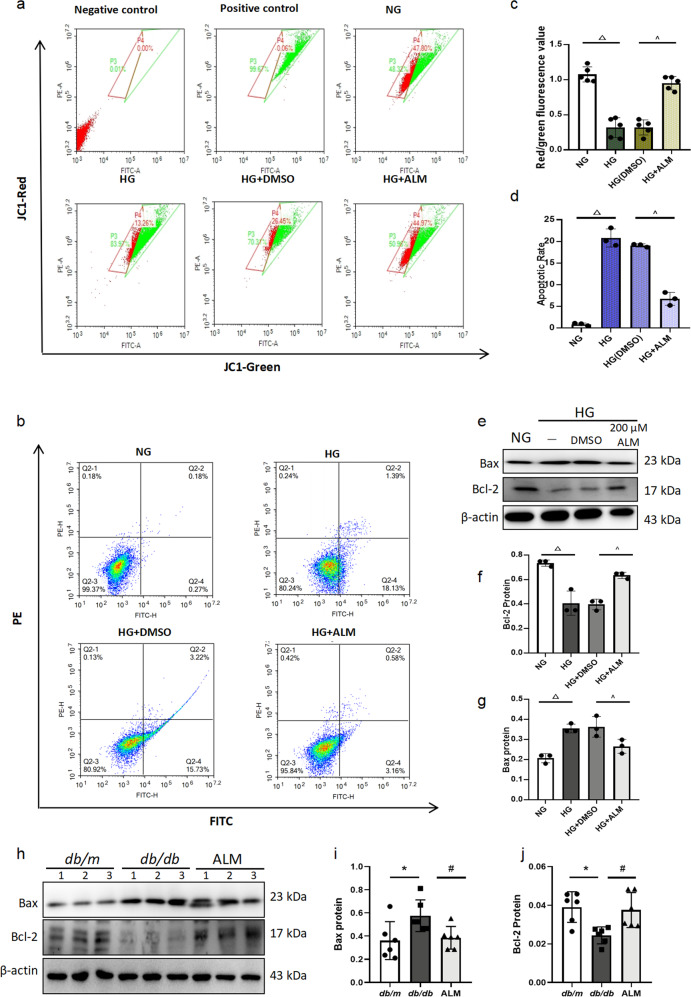
Fig. 4. ALM inhibited high glucose-mediated apoptosis in renal tubular epithelial cells.
Mitochondrial membrane potential (a, c) and apoptosis analyzed by flow cytometry (b, d). Immunoblot bands (e) and quantitative data (f, g) of Bax and Bcl-2 in NRK-52E cells of each group. Immunoblotting bands (h) and quantitative data (i, j) of Bax and Bcl-2 in kidney tissues of each group. Animal experiments: n = 6; *P < 0.05 vs. db/m group. #P < 0.05 vs. db/db group. Cell experiments: △P < 0.05 vs. NG group. ^P < 0.05 vs. HG + DMSO group. All cell data are mean ± SD from three independent experiments.

