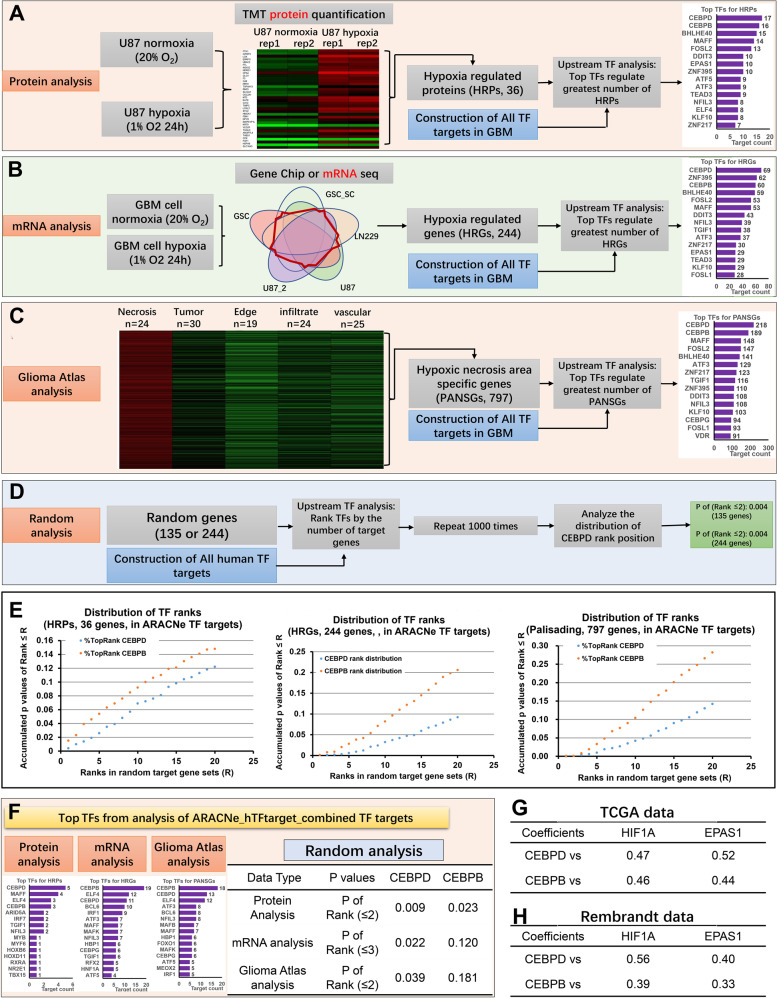
Fig. 1. Procedures of identifying key transcription factors (TFs) of the hypoxia-regulated genes in GBM.
A identification of key TFs from hypoxia-regulated proteins (HRPs). Quantitative TMT proteomic analysis identified significantly up-regulated proteins (HRPs) for at least 1.2-fold change under hypoxia. Then systemic TF-targets analysis identified top TFs which regulated the most number of targets belong to HRPs for all human TFs. The targets of each TF were identified with the mutual information-based ARACNe algorithms, as described previously [2]. B Similar procedure was performed in hypoxia-regulated genes (HRGs) in mRNA level, by using the statistically-reliable HRGs (SR-HRGs), which are genes overlapped in at least 3 sets from 5 hypoxia-induced gene sets. Then top TFs regulating the most number of targets belong to SR-HRGs were identified. C Similar procedure was further performed in pseudopalisading cells around necrosis (PAN) specific genes (PANSGs) in GBM tissues from glioblastoma atlas data [26]. PANSGs were those that are specifically significantly highly expressed in PAN area (p < 0.05), and with an averaged fold change greater than 2, compared to the other areas, including leading edge (LE), infiltrating tumor (IT), cellular tumor (CT), and microvascular proliferation (MVP). Then top TFs regulating the most number of targets that are specifically highly expressed in PAN area were identified. D Top TF analysis for Random target genes. Certain number (the same number of genes of the HRPs, HRGs, and PANSGs) of random genes, which are randomly selected from the corresponding background genome (all genes of the high-throughput platform), were produced to analyze the top TFs that regulate the random genes. Totally 1000 random gene sets were analyzed to produce a rank position distribution for each TF. E Rank position distributions of CEBPD and CEBPB in random target gene set analysis. Random targets with 36, 244, or 797 genes, were analyzed, corresponding to the gene numbers of HRPs, HRGs, and PANSGs, respectively. Data were obtained by repeating 1000 times. Rank distributions were analyzed for ARACNe-based TF targets. F Top TF analysis and rank distribution analysis of CEBPD and CEBPB for HRPs, HRGs, and PANSGs, where the targets of each TF were defined by the combined targets of ARACNe and hTFtarget-based targets [35] (ARACNe_hTFtarget_combined). G, H Correlations between top TFs (CEBPD and CEBPB) and HIFs (HIF1α and HIF2α/EPAS1) in TCGA (G) and Rembrandt (H) GBM databases.

