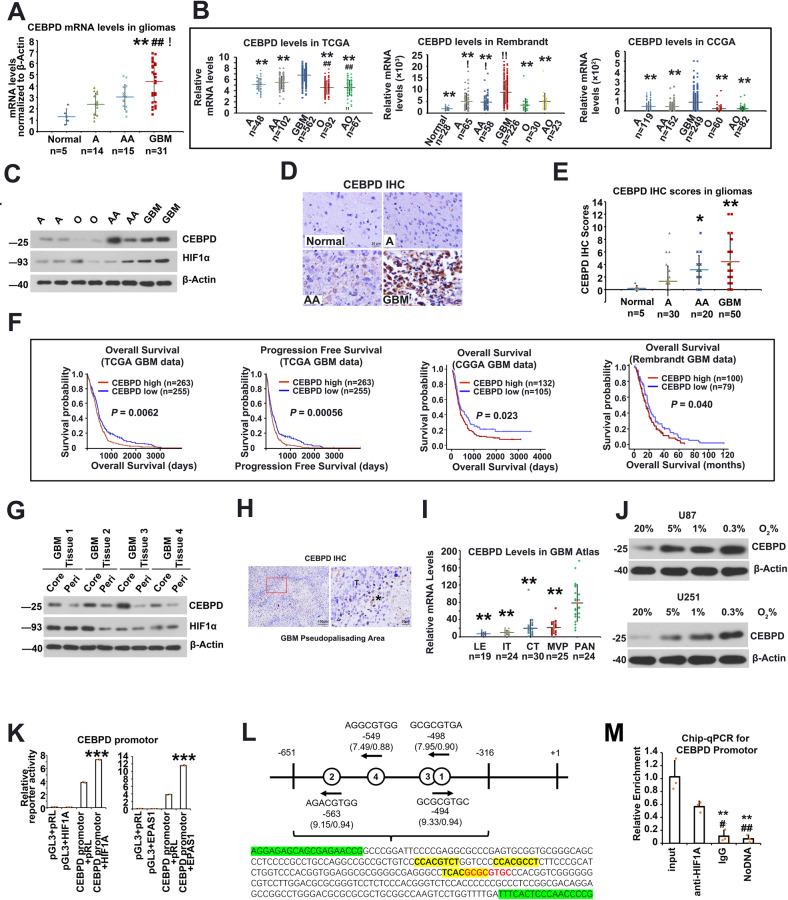
Fig. 2. CEBPD is highly expressed in GBM and is up-regulated under hypoxia.
A The mRNA levels of CEBPD, as revealed by qPCR, in a cohort of glioma samples with different grades (**p < 0.001 compared to Normal brain samples; ##p < 0.001 compared to grade 2 astrocytoma (A); !p < 0.05 compared to grade 3 anaplastic astrocytoma (AA). B Expression of CEBPD mRNA levels in different grades of gliomas in TCGA, Rembrandt, and CGGA datasets. (**p < 0.001 compared to Grade 4 GBM; ##p < 0.001 compared to Grade 3 AA; !p < 0.05, !!p < 0.001, compared to Normal brain samples.) C Representative WB results showing protein levels of CEBPD and HIF1α in different grade gliomas. D, E Representative IHC staining and quantitative staining scores of CEBPD in glioma samples (*p < 0.05, **p < 0.001, compared to grade 2 astrocytoma). F Survival analysis and progression-free analysis of GBM patients in different databases (TCGA, CGGA, and Rembrandt data). G WB results showing CEBPD protein levels in core hypoxic and peripheral less hypoxic areas in GBM samples (n = 3 independent experiments). H IHC staining showing CEBPD stain in hypoxic pseudo-palisading areas in GBM tissues; *, T, indicated pseudo-palisading areas and tumor area, respectively. I CEBPD mRNA levels in different areas in GBM tissues, including leading edge (LE), infiltrating tumor (IT), cellular tumor (CT), pseudopalisading cells around necrosis (PAN), and microvascular proliferation (MVP) areas, in the glioblastoma atlas data [26]; **p < 0.001, compared to PAN. J WB results showing CEBPD protein levels in GBM U87 and U251 cells under hypoxia condition. K Luciferase reporter assay showing bind and activation of HIF1α and HIF2α to the CEBPD promotor region (***p < 0.0001 compared to CEBPD-promotor-HIF-NC group). (pGL3: pGL3-Basic vector containing blank control; CEBPD promotor: pGL3-Basic vector containing CEBPD promoter sequence; pRL: pRL-TK vector containing blank control; HIF1A or EPAS1: pRL-TK vector containing HIF1A or EPAS1 TF sequence). L The DNA fragment with the highly reliable HIF1A or EPAS1 binding sites (Hypoxia-responsive Element, HRE) in the CEBPD promoter, as predicted by the JASPAR database [43]. There are 4 highly reliable HREs (bold letters) in the fragment. For each HRE, the sequence, location, and the binding scores (expressed as score/relative score) were labeled; red letters represent positive strand, while yellow shaded letters represent negative strand. Greed shaded letters represent sequences for primers. M Chip-qPCR showing that HIF1A bind to the CEBPD promoter region shown in (L). A grade 2 astrocytoma; O grade 2 oligodendroglioma; AA grade 3 astrocytoma; GBM grade 4 glioblastoma; peri peripheral.

