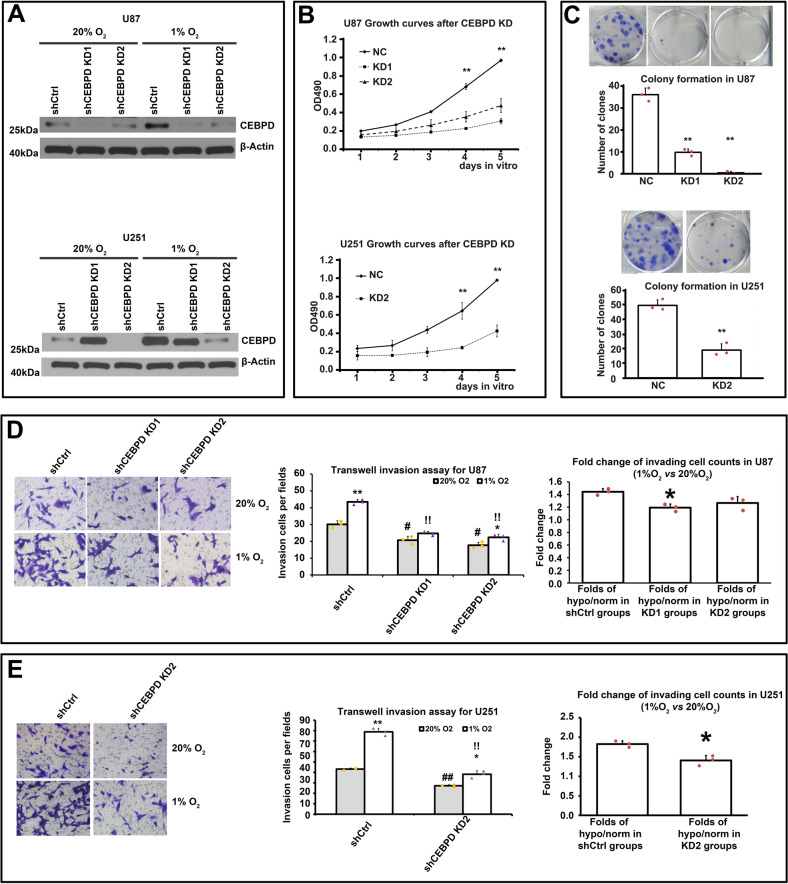
Fig. 3. knockdown of CEBPD inhibited invasion capacity of GBM cells.
A WB assays showing proteins levels of CEBPD after shCEBPD lentiviruses infection in U87 (up panel) and U251 (bottom panel) cells, in normoxia (20% O2) or hypoxia (1% O2) conditions. B In vitro CCK8 assays showing the effect of CEBPD knockdown on growth curves for U87 (up panel) and U251 cells (bottom panel). C In vitro colony formation assays of U87 (up panel) and U251 (bottom panel) cells with shCtrl or shCEBPD infection. D, E Transwell invasion assays of U87 (D) and U251 (E) cells infected with shCtrl or shCEBPD lentiviruses in normoxia (20% O2) or hypoxia (1% O2) conditions. **p < 0.001, *p < 0.05, compared with corresponding normoxia (20% O2) group; #p < 0.05 compared with shCtrl group in normoxia (20% O2); !p < 0.05 compared with shCtrl group in hypoxia (1% O2). Right images in (D, E): Fold increase of number of hypoxia induced invasion cells after shCtrl or shCEBPD treatment in U87 (D, right image) and U251 (E, right imag) cells. Repeated data for each group were obtained by calculating the ratio of each hypoxia data to the averaged value of normoxia data. *p < 0.05, compared with shCtrl group. Experiments were repeated in triplicate.

