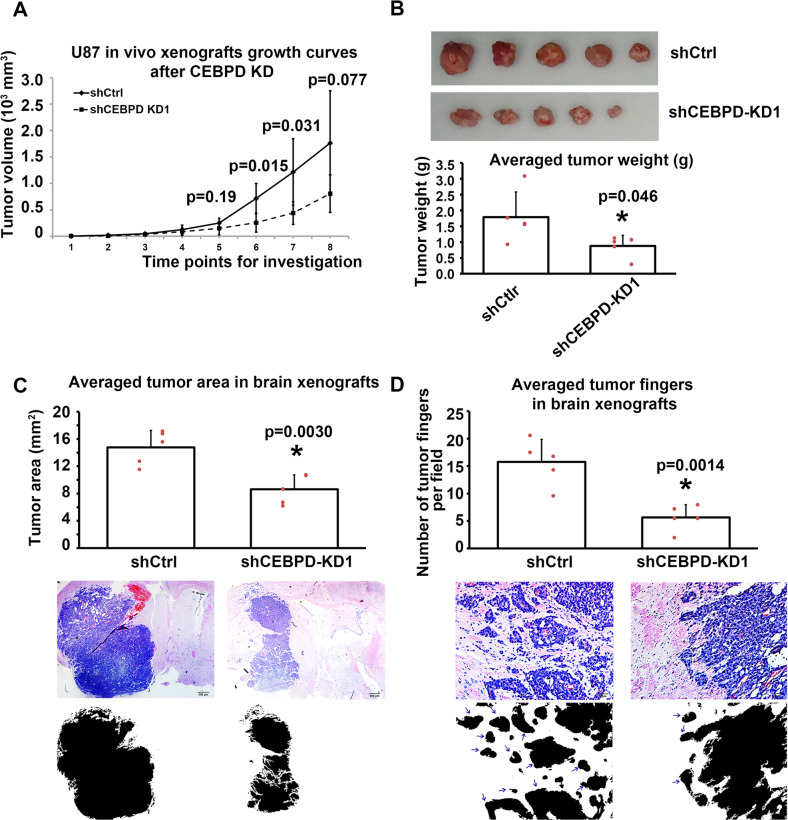
Fig. 4. CEBPD knockdown inhibited xenograft tumor growth and invasion capacity of GBM cells in vivo.
A, B Flank xenograft experiments showing the in vivo growth curves of U87 cells in shCtrl (n = 5) and shCEBPD groups (n = 5). C Intracranial xenografts tumor showing the tumor volumes in shCtrl (n = 5) and shCEBPD KD (n = 5) groups. The bottom binary images showed the tumor areas. D The invasion capacity of U87 cells in vivo in shCtrl and shCEBPD KD groups was evaluated by examining the number of tumor fingers in per field. The bottom binary images showed the tumor areas, where islands and protruded areas were indicated by arrows. *p < 0.05, compared with shCtrl group.

