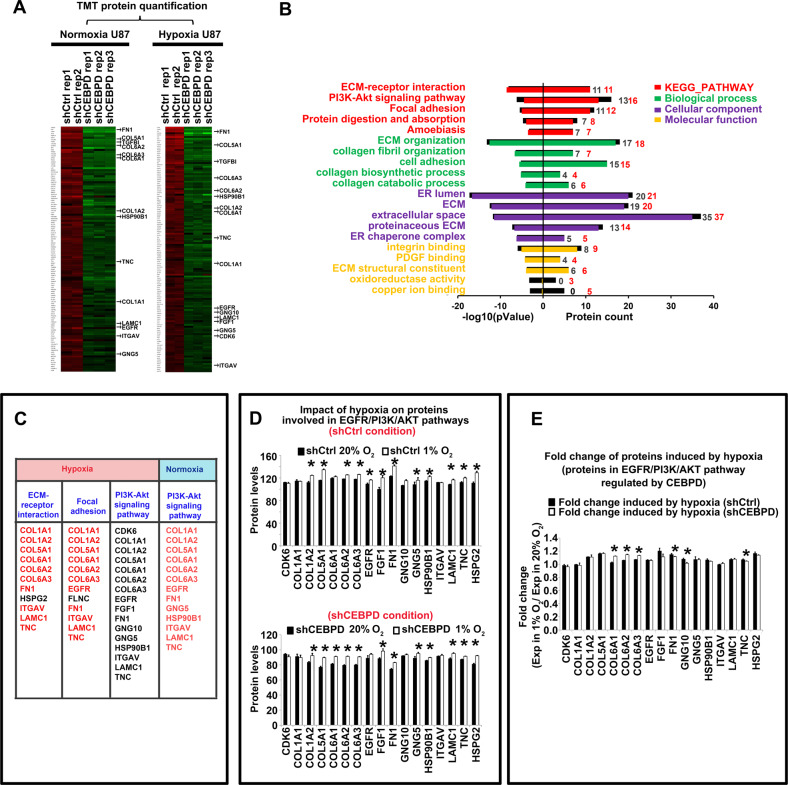
Fig. 5. CEBPD-regulated proteins in both normoxia and hypoxia conditions.
A TMT quantitative proteomic data, showing heatmap of protein levels in shCEBPD KD and shCtrl U87 cells, in both normoxia (20% O2) and hypoxia (1% O2) conditions. Proteins that are significantly down-regulated at least 1.2-folds after shCEBPD KD were chosen as the CEBPD-regulated proteins. The proteins were sorted in descending order from top to bottom according to their folds changes. B KEGG pathway analysis and Gene Ontology (GO) analysis of CEBPD positively regulated proteins in both normoxia and hypoxia conditions in U87 cells. Analyzed GO Categories include Biological process (BP), Cellular component (CM), and Molecular function (MF). The colored bars represent the −log10(p value) (left panel) and count of protein (right panel) for each enriched items for CEBPD-regulated protein in normoxia. The black bars, which are covered by the colored bars, represent the corresponding values for CEBPD-regulated proteins in hypoxia. The black parts that are not covered by the colored ones indicated that, for the specific item, the value of the item has a greater value in hypoxia condition than in normoxia condition. The black and red integers in the right panel indicate counts of proteins regulated by CEBPD in normoxia and hypoxia conditions, respectively. C Detailed proteins that are belong to the key KEGG pathways affected by CEBPD knockdown in both normoxia and hypoxia conditions. Proteins labeled with red are those which are also belong to the PI3K/Akt signal pathway. D Quantitative analysis of hypoxia impact on the protein levels that are belong to the key KEGG pathways, in shCtrl (up panel) or shCEBPD KD (bottom panel) conditions. *p < 0.05, compared with normoxia (20% O2) group. E Fold changes of hypoxia induced protein levels of the CEBPD-regulated genes in shCtrl and shCEBPD KD groups. *p < 0.05 compared with the shCtrl group. Repeated data for each group were obtained by calculating the ratio of each hypoxia data to the averaged value of normoxia data.

