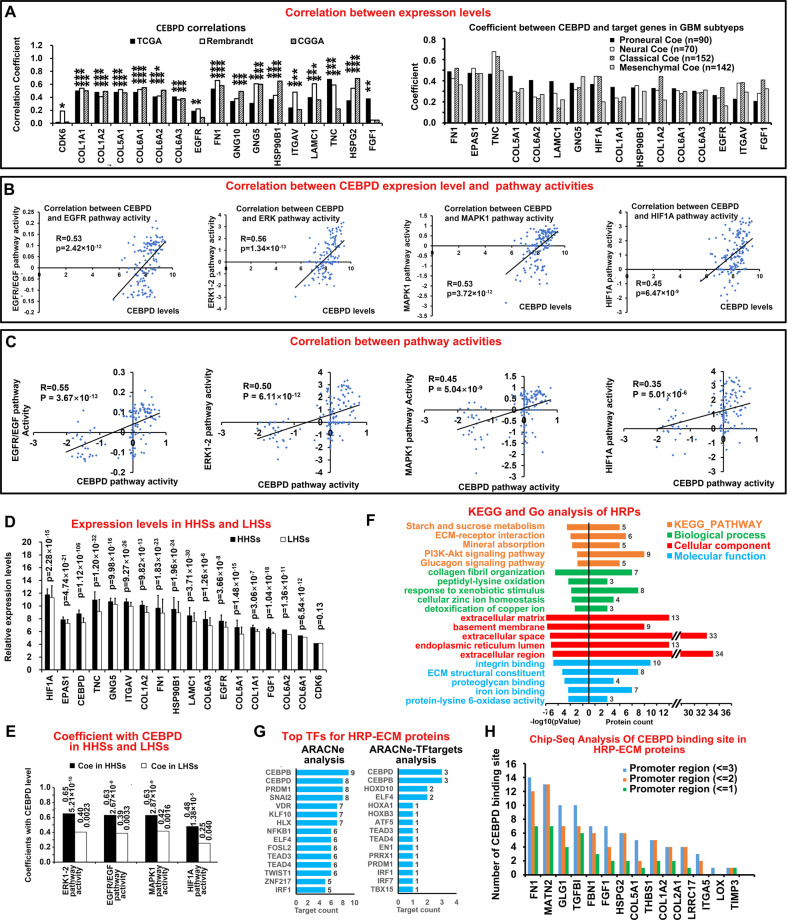
Fig. 7. Corroboration of the effect of CEBPD in GBM samples and enrichment analysis of hypoxia-regulated proteins.
A Correlations between expression levels of CEBPD and genes in EGFR/PI3K pathways (left image) in different databases (TCGA, Rembrandt, and CGGA). *P < 0.05, **(vertical) P < 10−5, ***(vertical) P < 10−10. In addition, correlations of CEBPD and these genes in each GBM subtype (Proneural, Neural, Classical, and Mesenchymal) were further performed in the TCGA database to test the impact of subtype on the correlations. B Correlations between CEBPD expression level and pathway activities of EGFR/PI3K and HIF1A. C Correlations between pathway activities of CEBPD and EGFR/PI3K related pathways, HIF1A pathways. D Expression levels of HIFs (HIF1A and EPAS1), CEBPD and genes in EGFR/PI3K pathways in high hypoxic samples (HHSs) and low hypoxic samples (LHSs) in the TCGA database. E Coefficients between CEBPD level and EGFR, HIF1A pathway activities in HHSs and LHSs. Digital labels for each bar indicate the coefficients (R, left label) and p values (right label). F KEGG pathway analysis and Gene Ontology (GO) analysis of HRPs in U87 cells. Analyzed GO Categories include Biological process (BP), Cellular component (CM), and Molecular function (MF). The colored bars represent the −log10(p Value) (left panel) and count of protein (right panel) for each enriched items. G Top TF analysis of ECM proteins belong to the HRPs (HRP-ECM), as described in Fig. 1. H Chip-seq analysis of CEBPD binding sites in HRP-ECM proteins. Bars represented number of CEBPD binding sites identified by Chip-seq in the promoters of the indicated proteins.

