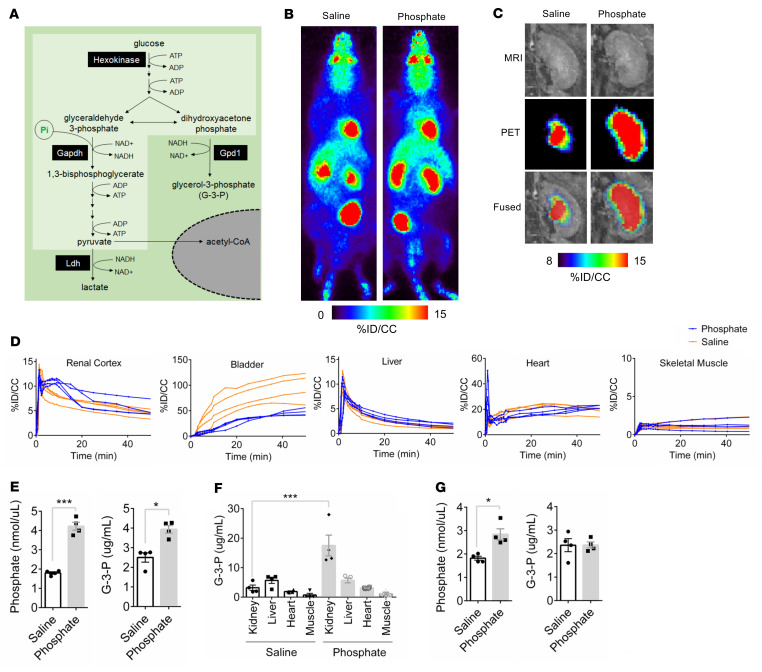
Figure 1. Phosphate stimulates kidney-specific glycolysis and G-3-P production.
(A) Schematic illustration of Pi’s entry into glycolysis (light green) and G-3-P biosynthesis. (B and C) Representative whole–animal maximum intensity projection PET scan images (B) and kidney coronal MRI, PET, and fused images (C) 10 minutes after i.v. 18F-FDG and either sodium phosphate or sodium chloride. (D) 18F-FDG signal expressed as percent injected dose per cubic centimeter of tissue (%ID/CC) in renal cortex, bladder, liver, heart, and skeletal muscle following i.v. 18F-FDG and either sodium phosphate or sodium chloride in C57BL/6J mice (n = 4 per group). (E and F) Blood phosphate and G-3-P concentrations (E) and tissue G-3-P concentrations (F) 10 minutes after i.v. sodium phosphate or sodium chloride in C57BL/6J mice (n = 4 per group). (G) Blood phosphate and G-3-P concentrations 10 minutes after i.v. sodium phosphate or sodium chloride in C57BL/6J mice that were pretreated with empagliflozin 10 mg/kg by oral gavage 2 hours before injections (n = 4 per group). Values are mean ± SEM. *P < 0.05, ***P < 0.0001. Unpaired Student’s t test (E and G) or ANOVA with Tukey’s multiple comparisons test (F).

