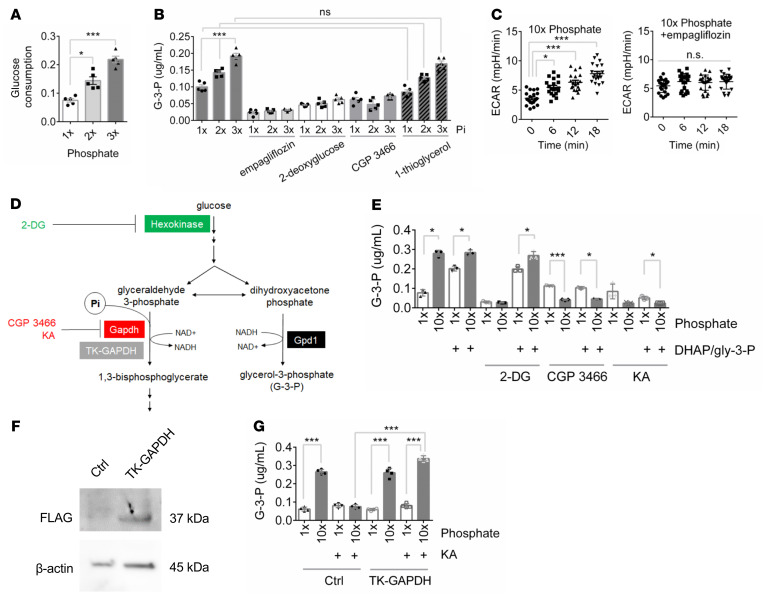
Figure 2. Phosphate-stimulated G-3-P production requires glycolysis.
(A) Media glucose consumption 6 hours after primary human proximal tubule cells were incubated with increasing concentrations of sodium phosphate (n = 5 per group). (B) Media G-3-P concentrations 6 hours after primary human proximal tubule cells were incubated with increasing concentrations of sodium Pi, ± empagliflozin (1 μM), 2-deoxyglucose (25 mM), CGP 3466 (5 μM), and 1-thioglycerol (10 mM) (n = 5 per group). (C) Extracellular acidification measured by Seahorse in OK cells treated with high phosphate ± empagliflozin (1 μM) (n = 16 per group). (D) Schema of hexokinase and Gapdh inhibition and rescue experiments. (E) Media G-3-P concentration 120 minutes after OK cells were incubated with 1 × or 10 × sodium phosphate, with or without 2-deoxyglucose (2-DG, 25 mM), CGP 3466 (5 μM), or koningic acid (KA; 33 μM), and with or without a mixture of 1 mM each dihydroxyacetone phosphate and glyceraldehyde-3-phosphate (DHAP/gly 3-P) (n = 3 per group). (F) Immunoblot of FLAG and β-actin in OK cells transfected with FLAG-TK-GAPDH or control vector. (G) Media G-3-P concentration at 120 minutes from OK cells transfected with TK-GAPDH or control vector incubated with 1 × or 10 × sodium phosphate, with or without KA (33 μM) (n = 4 per group). 1 × Pi = 0.9 mM. Values are mean ± SEM. *P < 0.05, ***P < 0.0001. ANOVA with Dunnett’s multiple comparisons test (A), ANOVA with Tukey’s multiple comparisons test (B, C, E, and G).

