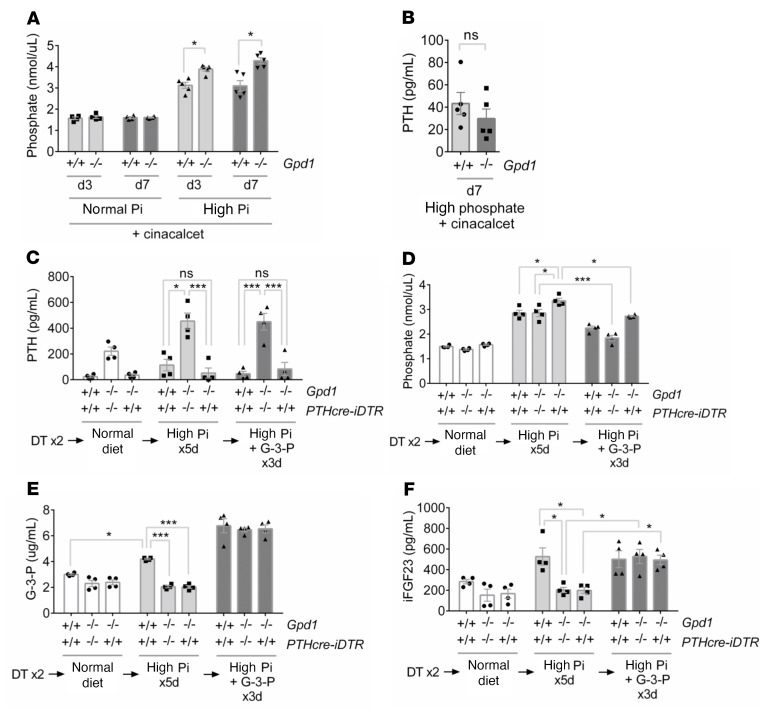
Figure 4. Gpd1–/– mice with induced hypoparathyroidism develop hyperphosphatemia that is rescued by G-3-P.
(A) Blood phosphate concentrations in Gpd1+/+ and Gpd1–/– mice fed a normal (0.6% Pi) or high phosphate (1.2% Pi) diet supplemented with cinacalcet for 3 and 7 days (n = 5 per group). (B) Blood PTH concentrations in Gpd1+/+ and Gpd1–/– mice fed a high phosphate diet supplemented with cinacalcet for 7 days (n = 5 per group). (C–F) Blood PTH (C), phosphate (D), G-3-P (E), and intact FGF23 (iFGF23) (F) concentrations in DT–treated Gpd1+/+-PTHcre-iDTR, Gpd1–/–, and Gpd1–/–-PTHcre-iDTR mice on a normal diet, after 5 days on a high phosphate diet, and after an additional 3 days on a high phosphate diet plus daily i.p. G-3-P (300 mg/kg) (n = 4 per group). Values are mean ± SEM. *P < 0.05, ***P < 0.0001. Unpaired student’s t test (A and B) or ANOVA with Tukey’s multiple comparisons test (C–F).

