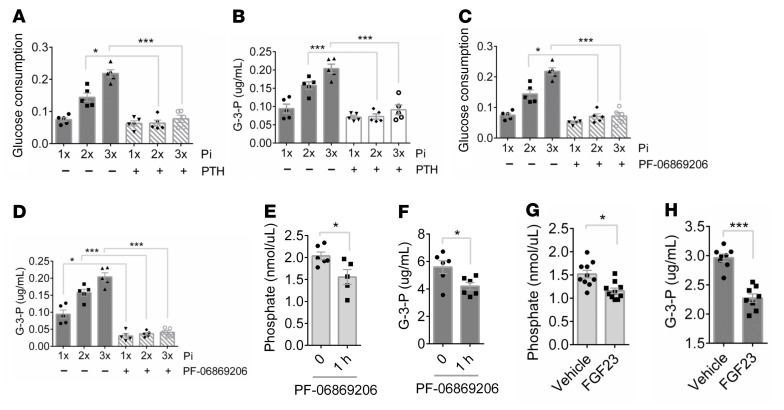
Figure 6. Npt2a inhibition reduces G-3-P production in vitro and in vivo.
(A and B) Media glucose consumption (A) and G-3-P concentration (B) from primary human proximal tubule cells treated with increasing concentrations of Pi ± PTH (0.1 μM) for 6 hours (n = 5 per group). (C and D) Media glucose consumption (C) and G-3-P concentration (D) from primary human proximal tubule cells treated with phosphate ± PF-06869206 (10 μM) for 6 hours (n = 5 per group). (E and F) Blood phosphate (E) and G-3-P concentrations (F) in C57BL/6J mice before and 1 hour after PF-06869206 dosing (300 mg/kg) (n = 5–6 per group). (G and H) Blood phosphate (G) and G-3-P concentrations (H) in C57BL/6J mice 12 hours after i.p. recombinant human FGF23 (5 μg) or vehicle (n = 8 per group). 1 × Pi = 0.9mM. Values are mean ± SEM. *P < 0.05, ***P < 0.0001. ANOVA with Tukey’s multiple comparisons test (A–D) or unpaired student’s t test (E–H).

