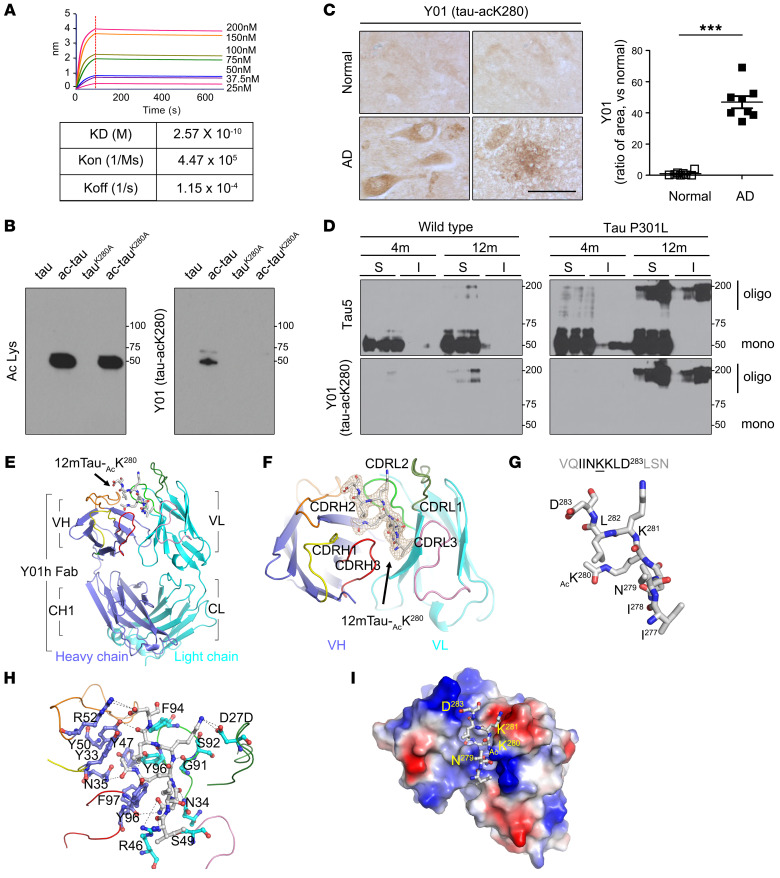
Figure 2. Characteristics and crystal structure of Y01, monoclonal anti–tau-acK280 antibody.
(A) Specific binding affinity of Y01 for tau-acK280. Dissociation constant between Y01 and ligand was measured by biolayer interferometry (Octet) using the 12mTau-acK280 peptide as the ligand (KD, dissociation constant; Kon, association rate; Koff, dissociation rate). (B) Representative immunoblots of tau proteins (ac-tau, tauK280A, and ac-tauK280A) with Ac Lys or Y01 antibody. (C) Immunohistochemistry (IHC) of normal aged or AD human hippocampus with Y01 antibody. Scale bar: 100 μm. Quantification of Y01 tau pathologies in AD patient hippocampus. n = 8 per group. Statistical analysis was performed by 1-way ANOVA followed by Tukey’s multiple-comparison test. ***P < 0.001. The error bars represent the SEM. (D) Immunoblots of soluble (S) and insoluble (I) formic acid fractions using mouse brains from 4- and 12-month-old WT and tau-P301L mice. (E) Overall complex structure of the Y01 and 12mTau-acK280. (F) Fo–Fc electron density map of tau peptide, contoured at 3.0 σ (gray mesh). The difference maps were generated after segmented rigid body, positional, and isotropic B-factor refinements of the antibody in the absence of the tau peptide. (G) Sequences and structures of the tau peptide in the complex structure. The Y01 structure is shown as cartoons in subdomain-specific colors (blue, heavy chains; light blue, light chains; yellow, CDRH1; orange, CDRH2; red, CDRH3; light green, CDRL1; green, CDRL2; pink, CDRL3). The tau peptide is shown as gray sticks (gray, carbon; red, oxygen; blue, nitrogen). (H) A closed view of the Y01–12mTau-acK280 complex. Y01 is depicted as ribbons. Y01 residues that contact the tau peptide are represented by blue and light blue ball-and-stick models indicating heavy and light chains, respectively (red, oxygen; blue, nitrogen). Hydrogen bonds between Y01 and tau peptide are depicted as broken lines. (I) Electrostatic interactions between Y01 and 12mTau-acK280 peptide. The structure of Y01 is shown as an electrostatic potential surface, ranging from acidic (red) to basic (blue). The tau peptide is shown as gray ball-and-stick models (red, oxygen; blue, nitrogen).

