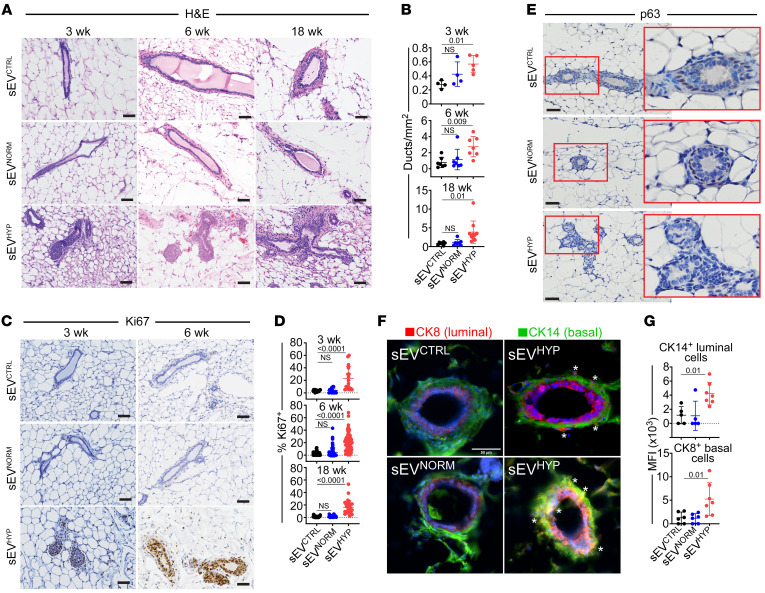
Figure 1. Hypoxic sEVs (sEVHYP) induce mammary gland hyperplasia in vivo.
(A and B) AT3 cell–derived sEVs were injected in the abdominal mammary gland of immunocompetent C57BL/6 female mice, and tissue samples were analyzed after 3, 6, and 18 weeks by H&E staining and immunohistochemistry (IHC) (A, representative images) with quantification of the number of mammary gland ducts (B). Scale bars: 100 μm. Mean ± SD (n = 4). (C and D) Mammary gland tissues as in A were stained with an antibody against Ki67 by IHC (C, representative images), and the percentage of positive cells was quantified (D). Scale bars: 100 μm. Mean ± SD (n = 4). (E) Mammary gland tissues were analyzed for p63 reactivity after 6 weeks by IHC. Representative images (n = 4). Scale bars: 100 μm. Red boxes, magnification of indicated areas. (F) Mammary gland tissues were analyzed after 6 weeks for expression of luminal marker cytokeratin 8 (CK8, red) and basal marker cytokeratin 14 (CK14, green) by immunofluorescence microscopy. Asterisks, mislocalized apical-basal markers in sEVHYP-treated mammary gland. Representative images (n = 5). Scale bar: 50 μm. (G) Conditions were as in F, and mammary glands injected with the various sEVs were quantified for apical-basal mislocalization of CK8+ or CK14+ cells. MFI, mean fluorescence intensity. Mean ± SD. For all panels, numbers correspond to P values by 1-way ANOVA with Tukey’s multiple-comparison test.

