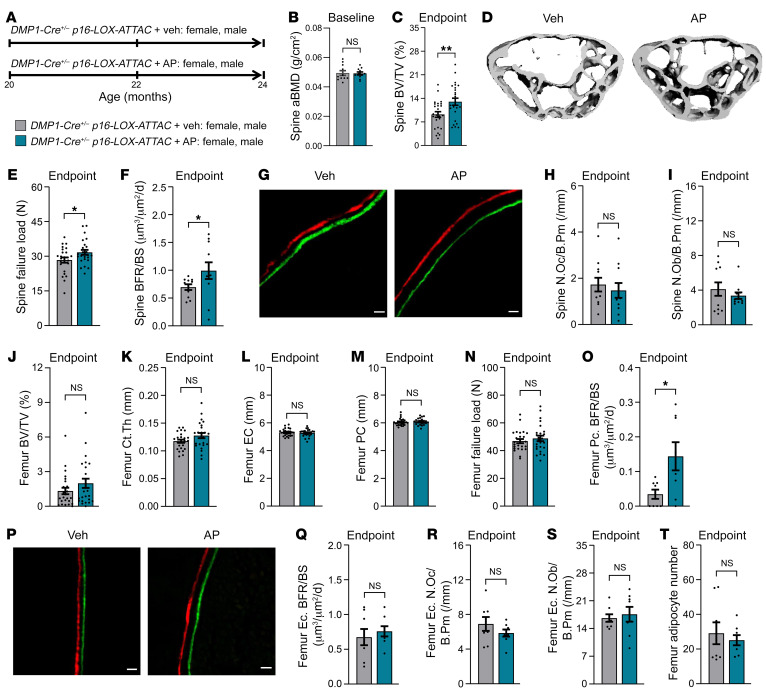
Figure 3. Effects of local Sn osteocyte–specific clearance on the skeleton of old mice.
(A) Study design in old (20 months) DMP1-Cre+/– p16-LOX-ATTAC mice, males and females combined, randomized to Veh (gray) or AP (teal). (B) DXA-derived aBMD (g/cm2) at baseline (20 months; n = 11/group: n = 6 females, n = 5 males per group). (C) Endpoint lumbar spine μCT-derived bone volume fraction (BV/TV; %) in Veh-treated (n = 25; n = 15 females, n = 10 males) versus AP-treated (n = 25: n = 15 females, n = 10 males) mice. (D) Representative spine μCT images of Veh- versus AP-treated mice. (E) Lumbar spine μFEA-derived failure load in Veh-treated mice (n = 25: n = 15 females, n = 10 males) versus AP-treated (n = 25: n = 15 females, n = 10 males). (F) Lumbar spine BFR per bone surface (BFR/BS) (μm3/μm2/d; n = 11/group: n = 6 females, n = 5 males per group). (G) Lumbar spine representative images of Alizarin red and calcein fluorochrome dynamic BFR labels on trabecular surfaces in Veh- and AP-treated mice. Scale bars: 10 μm. (H and I) Lumbar spine histomorphometric quantification (n = 8/group: n = 4 females, n = 4 males per group) of (H) osteoclast numbers per bone perimeter (N.Oc/B.Pm/mm) and (I) osteoblast numbers per bone perimeter (N.Ob/B.Pm/mm). (J–N) Femur metaphysis μCT-derived (J) BV/TV, (K) cortical thickness, (L) endocortical circumference, (M) periosteal circumference, and (N) μFEA-derived failure load (n = 25/group: n = 15 females, n = 10 males per group). (O) Femur histomorphometric quantification (n = 8/group: n = 4 females, n = 4 males per group) of periosteal cortical (Pc.) BFR/BS (μm3/μm2/d). (P) Representative images of Alizarin red and calcein fluorochrome dynamic BFR labeling on periosteal cortical surfaces of femurs from Veh- and AP-treated mice. Scale bars: 10 μm. (Q–T) Femur histomorphometric quantification (n = 8/group: n = 4 females, n = 4 males per group) of (Q) endocortical (Ec.) BFR/BS (μm3/μm2/d), (R) endocortical N.Oc/B.Pm (/mm), (S) endocortical N.Ob/B.Pm (/mm), and (T) bone marrow adipocyte numbers. Data represent the mean ± SEM. NS, P > 0.05; *P < 0.05 and **P < 0.01, by independent samples Student’s t test or Wilcoxon rank-sum test, as appropriate.

