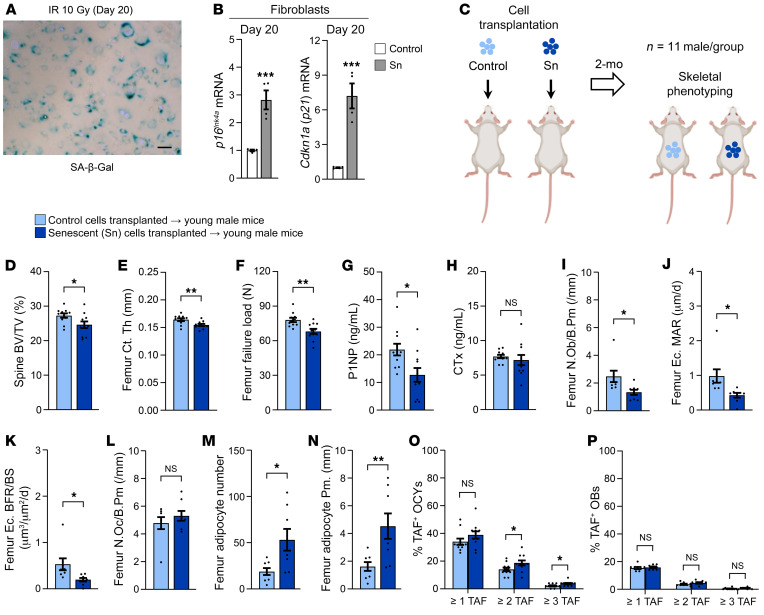
Figure 6. Transplantation of cells made Sn by IR causes skeletal aging in young adult mice.
(A) Confirmation of cellular senescence 20 days after 10 Gy IR using SA–β-Gal staining. Scale bar: 25 μm. (B) RT-qPCR analysis of p16Ink4a and p21Cip1 mRNA expression in Sn versus control fibroblasts 20 days after 10 Gy IR. (C) Study design for control and Sn cell transplantation (via i.p. injection) and skeletal phenotyping in young adult male C57BL/6 WT mice (n = 11 males/group). (D–F) Quantification of μCT-derived (D) lumbar spine BV/TV fraction, (E) femur metaphysis cortical thickness, and (F) femur metaphysis μFEA-derived failure load (i.e., bone strength) in mice transplanted with control (n = 11 males) versus Sn (n = 11 males) cells. (G and H) Quantification of circulating serum bone turnover markers, including (G) the bone formation marker P1NP (ng/mL) and (H) the bone resorption marker cross-linked CTx (ng/mL) (n = 11 males/group). (I–L) Histomorphometric quantification at the femoral endocortical surface of (I) osteoblast numbers per bone perimeter (/mm), (J) mineral apposition rate (MAR) (μm/d), (K) BFR/BS (μm3/μm2/d), and (L) osteoclast numbers per bone perimeter (/mm) (n = 8 males/group). (M and N) Histomorphometric quantification of femur bone marrow (M) adipocyte numbers and (N) adipocyte perimeter (mm) (n = 8 males/group). (O and P) Quantification of (P) the mean percentage of TAF+ osteocytes per mouse and (P) the mean percentage of TAF+ osteoblasts per mouse based on the following criteria: the percentage of cells with 1 or more TAF, the percentage of cells with 2 or more TAF, and the percentage of cells with 3 or more TAF, respectively. Data represent the mean ± SEM. NS, P > 0.05; *P < 0.05, **P < 0.01, and ***P < 0.001, by independent samples Student’s t test or Wilcoxon rank-sum test, as appropriate.

