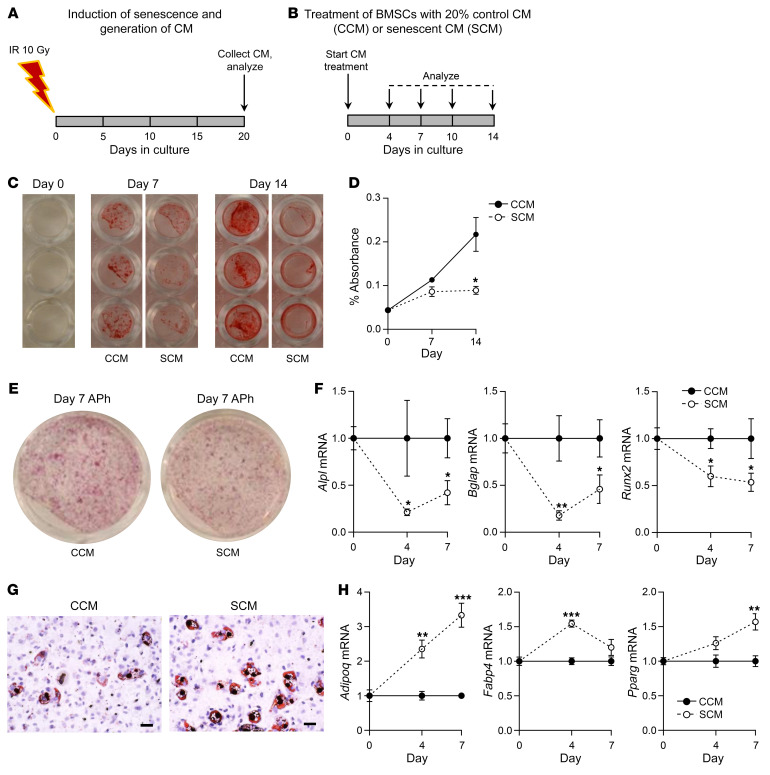
Figure 7. The SASP impairs bone formation and enhances bone marrow adipogenesis.
(A) Schematic of in vitro cellular senescence induction using 10 Gy IR and generation of CM following 20 days in culture. (B) Study design depicting the treatment of BMSCs with 20% control CM (CCM) or Sn CM (SCM) for 14 days. (C) Mineralization of BMSCs exposed to control CM or Sn CM at days 0, 7 (n = 6/group), and 14 (n = 6/group). (D) Quantification of eluted Alizarin red dye from BMSCs exposed to control CM or Sn CM at days 0, 7 (n = 6/group), and 14 (n = 6/group). (E) Representative images of APh staining of BMSCs exposed to control CM or Sn CM on day 7. (F) Changes in mRNA expression of osteoblastic genes in BMSCs exposed to either control CM (n = 6) or Sn CM (n = 6). (G) Representative images of Oil Red O staining of BMSCs exposed to either control CM or Sn CM. Scale bars: 25 μm. (H) Changes in mRNA expression of adipogenic genes in BMSCs exposed to either control CM or Sn CM (n = 6/group). Data represent the mean ± SEM. *P < 0.05, **P < 0.01, and ***P < 0.001, by independent samples Student’s t test or Wilcoxon rank-sum test, as appropriate.

