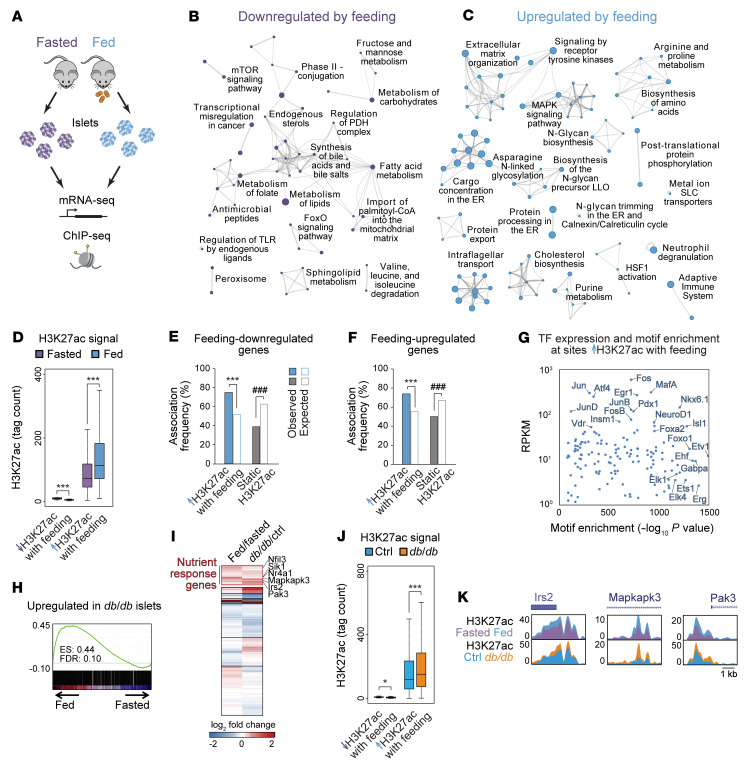
Figure 1. Nutrient state regulates histone acetylation and transcription in pancreatic islets.
(A) Schematic of experiments performed. (B and C) Networks of genes downregulated (B) or upregulated (C) (P < 0.01 by Cuffdiff) by feeding relative to fasting, shown as clustered functional categories. n = 3. (D) H3K27ac ChIP-Seq signal at sites losing or gaining H3K27ac with feeding (P < 0.01 by DEseq2). n = 3. ***P < 0.001, Wilcoxon’s rank-sum test. (E and F) Association frequencies between TSSs of genes downregulated (E) or upregulated (F) by feeding with the indicated classes of H3K27ac peaks ± 10 kb. White bars indicate association frequencies expected by chance. ***P < 0.001 for enrichment; ###P < 0.001 for depletion; NS, not significant by permutation test. (G) TF motifs enriched at sites gaining H3K27ac with feeding relative to all other H3K27ac peaks plotted against mRNA levels of cognate TFs in islets from fed mice. (H) GSEA of genes upregulated in db/db compared with control (ctrl, db/+) islets (P < 0.01 by Cuffdiff; n = 3) against mRNA-Seq data from islets after feeding and fasting. (I) K-means clustering of log2 fold changes in mRNA levels in islets after feeding compared with fasting and in db/db compared with control islets. (J) ChIP-Seq signal for H3K27ac at the indicated classes of H3K27ac peaks in db/db and control islets. n = 2. ***P < 0.001, Wilcoxon’s rank-sum test. (K) H3K27ac ChIP-Seq genome browser tracks for the indicated genes. Box plot whiskers span data points within the interquartile range × 1.5.

