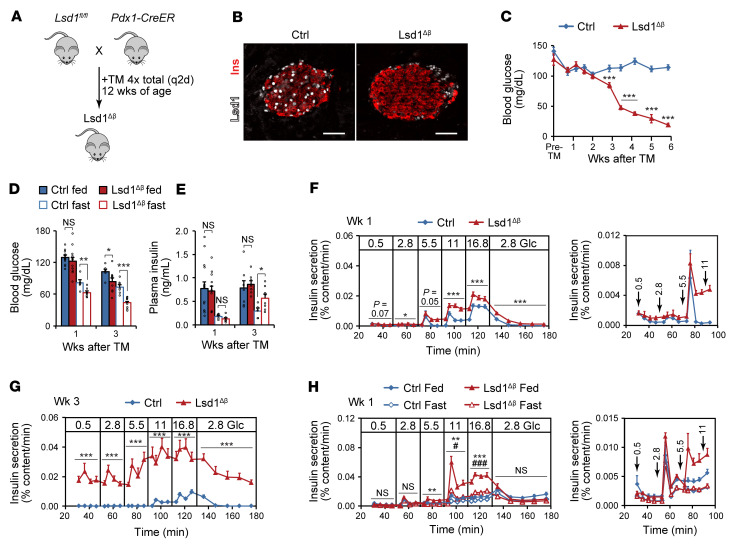
Figure 3. Lsd1 inactivation in β cells causes insulin hypersecretion and hypoglycemia.
(A) Schematic of alleles and treatments used to inactivate Lsd1. TM, tamoxifen; q2d, every other day. (B) Immunofluorescence staining for insulin (Ins) and Lsd1 on pancreas sections from control (control TM-treated Lsd1fl/+; Pdx1-CreER) and Lsd1Δβ mice 2 days after TM treatment. Scale bars: 50 μm. (C) Time course of ad libitum–fed blood glucose levels in control (TM-treated Lsd1+/+; Pdx1-CreER) and Lsd1Δβ mice. n = 9–10 mice. Pre-TM, within 3 days prior to initial TM injection. ***P < 0.001, unpaired 2-tailed t test. (D and E) Blood glucose (D) and serum insulin (E) levels in ad libitum–fed and 16 hour–fasted mice. n = 5–15 mice. *P < 0.05; **P < 0.01; ***P < 0.001, unpaired, 2-tailed t test. (F and G) Insulin secretion by control and Lsd1Δβ islets during perifusion with the indicated glucose (Glc) concentrations (in mM) at 1 week (F) and 3 weeks (G) following TM treatment. n = 4 pools of 130 islets. Right (F), data shown at a reduced scale. *P < 0.05; ***P < 0.001, 2-way ANOVA for genotype for each time block. (H) Insulin secretion by control and Lsd1Δβ islets during perifusion with the indicated glucose concentrations (in mM) from mice that were feeding entrained and then fed or fasted as in Supplemental Figure 1A. n = 3 pools of 130 islets. Right, data shown at a reduced scale for the indicated time points. **P < 0.01; ***P < 0.001, 2-way ANOVA for genotype between fed islets for each time block. #P < 0.05; ###P < 0.001, 2-way ANOVA for genotype between fasted islets for each time block. Data are represented as mean ± SEM.

