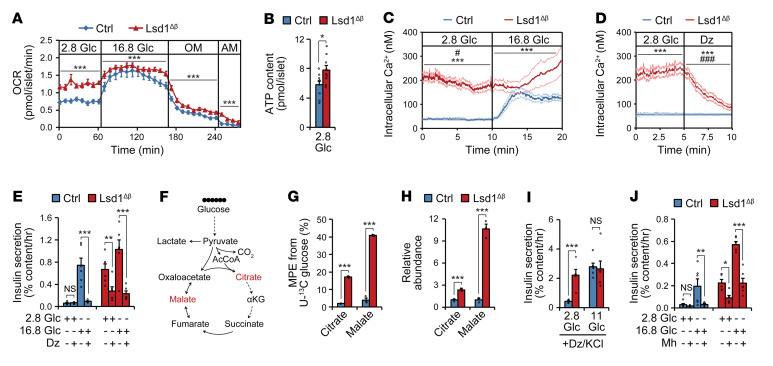
Figure 4. Accelerated glucose metabolism promotes insulin hypersecretion in Lsd1Δβ islets.
(A) Oxygen consumption rate (OCR) of islets treated sequentially with the indicated glucose concentrations (in mM), oligomycin (OM), and antimycin A (AM). n = 8–10 pools of 60 islets. ***P < 0.001, 2-way ANOVA for genotype for each time block. (B) ATP content of islets. n = 9–10 pools of 20 islets. *P < 0.05, unpaired 2-tailed t test. (C and D) Intracellular Ca2+ concentration of β cells treated with glucose (in mM) (C) or the KATP channel opener diazoxide (Dz) (D). n = 32–46 β cells, representative of 3 independent experiments. ***P < 0.001, 2-way ANOVA for genotype for each time block. #P < 0.05; ###P < 0.001, 2-way ANOVA for the interaction between genotype and time for each time block. (E) Insulin-secretion by islets with and without Dz. n = 5–6 pools of 10 islets. **P < 0.01; ***P < 0.001, pairwise t test corrected for multiple comparisons with the Benjamini-Hochberg procedure following 2-way ANOVA for genotype and stimulation condition. (F) Schematic of tracing experiment. (G and H) Molar percentage enrichment (MPE) of 13C (G) and relative abundances (H) of indicated metabolites after tracing with 2.8 mM U-13C glucose. n = 3 pools of 220 islets. ***P < 0.001, unpaired 2-tailed t test. (I and J) Insulin secretion by islets under depolarizing conditions (30 mM KCl and 100 μM Dz) (I) or with and without the glycolysis inhibitor mannoheptulose (Mh) (J). n = 5–6 pools of 10 islets. *P < 0.05; **P < 0.01; ***P < 0.001, pairwise t test corrected for multiple comparisons with the Benjamini-Hochberg procedure following 2-way ANOVA for genotype and stimulation condition. Islets were isolated from ad libitum–fed animals 3 weeks following tamoxifen treatment. Data are represented as mean ± SEM.

