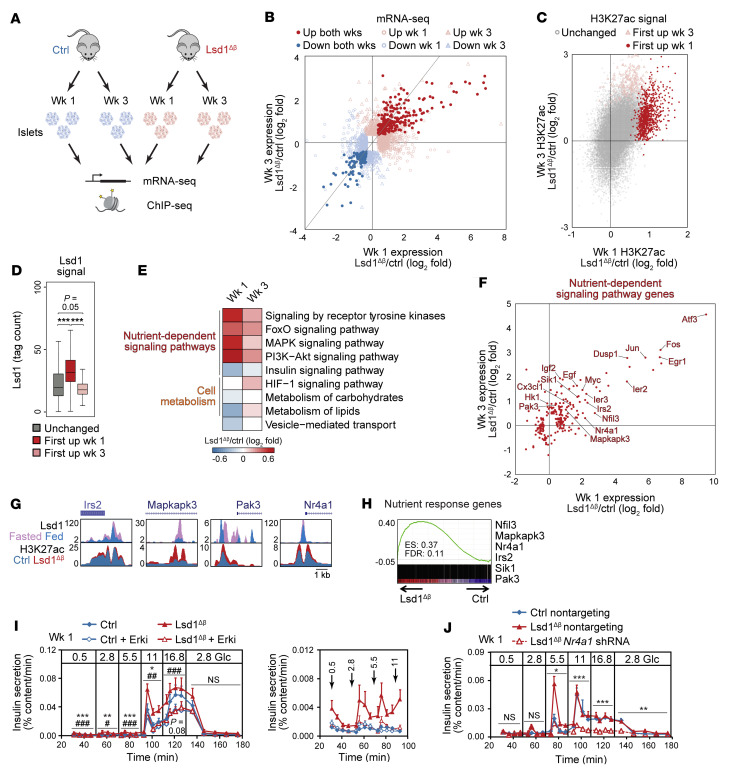
Figure 5. Lsd1 inactivation in β cells deregulates genes involved in nutrient-dependent signaling and cell metabolism.
(A) Schematic of experiments. wk/s, week/s. (B) Relative mRNA levels for differentially expressed genes (P < 0.01 by Cuffdiff). Gray line indicates slope of 1. n = 3–5. (C) Relative H3K27ac ChIP-Seq signal at H3K27ac peaks. n = 2. (D) Lsd1 ChIP-Seq signal at classes of H3K27ac peaks. Lsd1 ChIP-Seq data are from n = 1 replicate, highly correlated with an independent biological replicate, from islets of ad libitum–fed mice. Box plot whiskers span data points within the interquartile range × 1.5. ***P < 0.001, Wilcoxon’s rank-sum test corrected for multiple comparisons with Benjamini-Hochberg procedure. (E) Median log2 fold expression changes for functional categories. (F) log2 fold changes for differentially expressed genes (P < 0.01 by Cuffdiff) annotated to nutrient-dependent signaling pathways. n = 3–5. (G) ChIP-Seq genome browser tracks Lsd1Δβ islet data shown at 1 week following TM treatment. (H) GSEA of nutrient-response genes (from Figure 1I) against mRNA-Seq data from Lsd1Δβ islets 1 week following TM treatment. (I and J) Insulin secretion by islets during perifusion with the indicated glucose concentrations (in mM) following 24-hour treatment with SCH772984 (Erki) or vehicle (I) or following transduction with shRNAs (J). Right (I), data shown at a reduced scale. n = 6 pools of 130 islets (I) or n = 3 pools of 220 reaggregated islets (J). Data are represented as mean ± SEM. *P < 0.05; **P < 0.01; ***P < 0.001 by 2-way ANOVA for genotype in vehicle-treated islets for each time block. #P < 0.05; ##P < 0.01; ###P < 0.001, Erki-treated relative to vehicle-treated Lsd1Δβ islets by 2-way ANOVA for treatment group for each time block (I). *P < 0.05; **P < 0.01; ***P < 0.001, by 2-way ANOVA for shRNA for each time block (J).

