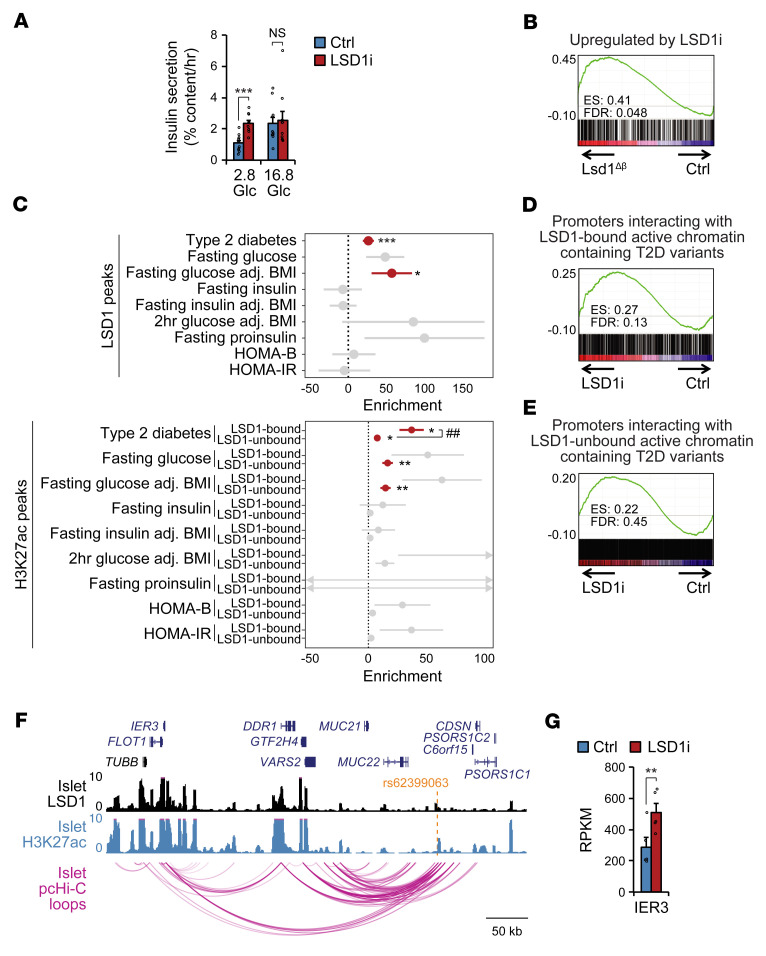
Figure 6. LSD1 regulates insulin secretion in human islets, and its binding sites are enriched for T2D-associated variants.
(A) Static insulin-secretion assay in human islets stimulated with the indicated glucose concentrations (in mM) following 24-hour treatment with the LSD1i TCP or vehicle control. n = 8 donors. Data are represented as mean ± SEM. ***P < 0.001, paired, 2-tailed t test. (B) GSEA of mouse orthologs of genes upregulated by LSD1i treatment in human islets (P < 0.01 by Cuffdiff; n = 5 donors) against mRNA-Seq data from Lsd1Δβ and control mouse islets 1 week following TM treatment. (C) GWAS enrichment (%h2/%SNPs) of metabolic traits at LSD1 ChIP-Seq peaks (from n = 2 donors, top) and H3K27ac ChIP-Seq peaks associated with an LSD1 peak ± 1 kb or not associated with an LSD1 peak (bottom) in human islets using LD-score regression. Data shown represent enrichment estimate and SEM, and significant estimates are highlighted in red. *P < 0.05; **P < 0.01; ***P < 0.001 (Bonferroni-corrected) for enrichment by LD-score regression. ##P < 0.01 for differences in enrichment between LSD1-bound and -unbound active chromatin by 2-tailed Welch’s t test. (D and E) GSEA of genes whose promoters interact with an LSD1-bound (D) or LSD1-unbound (E) site containing a T2D-associated variant from pcHi-C data against mRNA-Seq data from LSD1i-treated and control human islets. (F) LSD1 and H3K27ac ChIP-Seq and pcHi-C (17) genome browser tracks from human islets. (G) Bar graph of IER3 mRNA levels in human islets treated with LSD1i as in A. Data are represented as mean ± SEM. **P < 0.01 by Cuffdiff.

