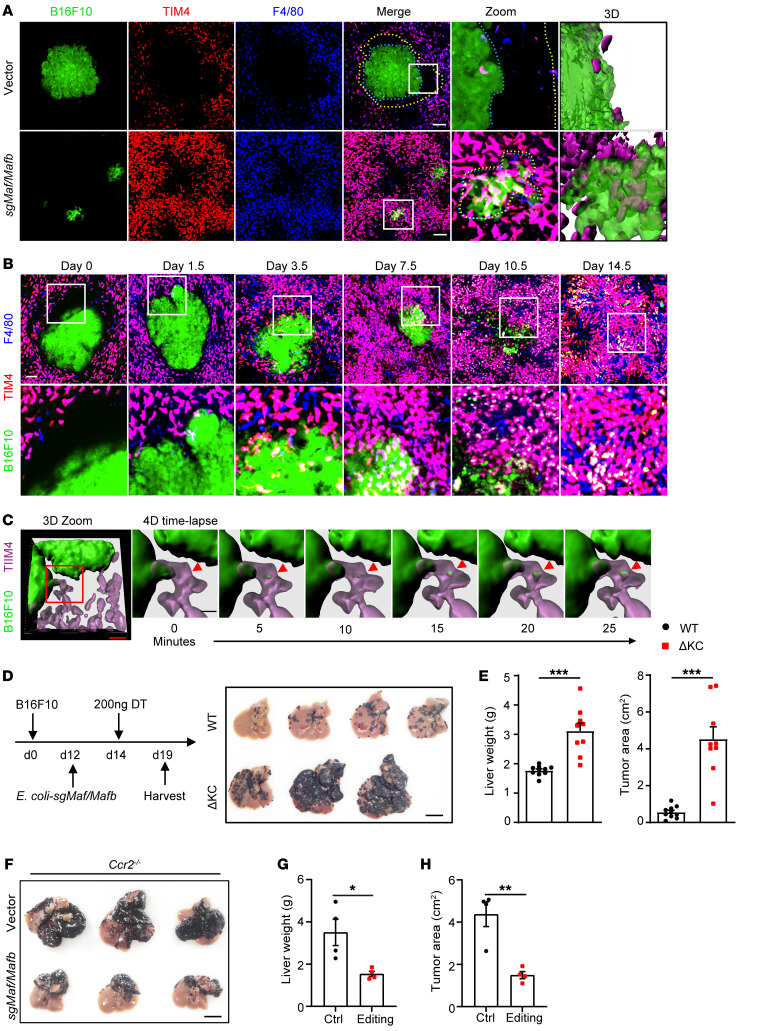
Figure 6. KC-dependent elimination of liver metastasis during BIL-CRISPR–mediated bacterial therapy.
(A) Mice with established B16F10 liver metastasis were treated with E. coli–vector or E. coli–sgMafb/Maf i.v. Representative intravital liver images at 7 days after bacterial treatment are shown. Scale bars: 100 μm. Original magnification, zoomed images: × 3.8. Peritumoral KC dark zones are show between yellow and blue dashed lines. (B) Intravital liver images of tumor-KC interfaces at various time points after bacterial treatment. Scale bars: 100 μm. Original magnification, zoomed images: × 2.9. (C) Representative time-lapse 3D intravital liver images showing KCs nibbling an interacting cancer cell after bacterial therapy. Scale bars: 40 μm (red); 15 μm (black). (D) WT or Clec4f-iDTR mice with established B16F10 liver tumors were treated with DT 2 days after ClearColi sgMafb/Maf treatment, and the livers were harvested 5 days later, as depicted. Scale bars: 1 cm. (E) Liver weights and tumor area on the surface of livers were measured in D. n = 9–10 mice per group pooled from 3 independent experiments. (F) Ccr2–/– mice with established B16F10 liver tumors were injected with ClearColi-vector or ClearColi-sgMafb/Maf at day 12 and harvested at day 19. (G and H) Liver weights and the tumor area on the surface of livers from F were measured. n = 4 mice from 1 of 2 independent experiments. Data are represented as mean ± SEM. *P < 0.05; **P < 0.01; ***P < 0.001, unpaired Student’s t test.

