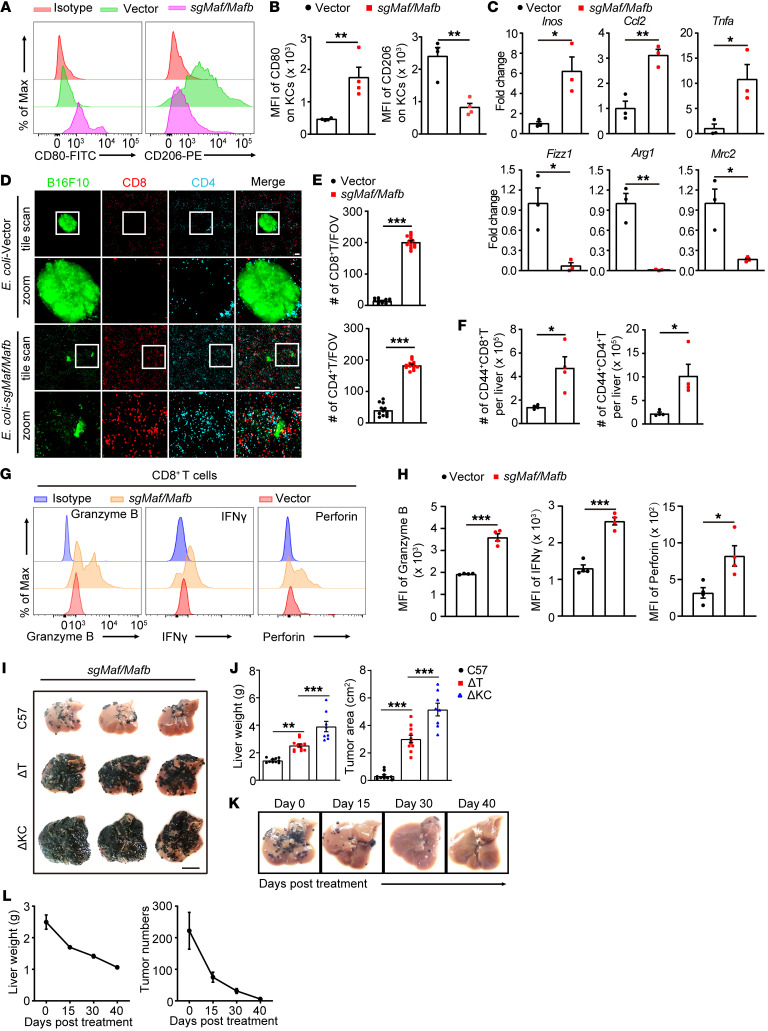
Figure 7. Reshaping the tumor microenvironment by BIL-CRISPR–mediated bacterial therapy.
(A) Mice with established B16F10 liver metastasis were treated with E. coli–vector or E. coli–sgMafb/Maf for 7 days. Representative flow cytometric plots of CD80 and CD206 expression on KCs are shown. KCs were pregated as CD45+Ly6G CD11bloF4/80hiTIM4+ cells. (B) MFI of CD80 and CD206 on KCs was quantified. n = 4 mice. (C) Normalized mRNA expression of Inos, Ccl2, Tnfα, Fizz1, Arg1, and Mrc2 in KCs sorted from bacteria-treated tumor-bearing mice. n = 3 mice. (D) Representative liver images showing tumor infiltration of T cells 7 days after bacterial treatment. Scale bars: 100 μm. Original magnification, zoomed images: × 3.0. (E) Number of CD4+ and CD8+ T cells per FOV in D; a total of 12 FOVs from 3 mice per group were analyzed. (F) Number of hepatic CD44+CD4+ and CD44+CD8+ T cells measured by flow cytometry. n = 4 mice. (G) Representative histogram and (H) MFI of granzyme B, IFN-γ, or perforin expression in hepatic CD8+ T cells from E. coli–vector or E. coli–sgMafb/Maf treated mice. n = 4 mice. (I) Sex- and age-matched WT, CD4-iDTR, or Clec4f-iDTR mice with established B16F10 liver tumors were treated with DT at day 2 after ClearColi-sgMafb/Maf injection, and the livers were harvested at day 7. Scale bar: 1 cm. (J) Liver weights and tumor area in I were measured. n = 8–11 mice. (K) B16F10 tumor-bearing mice were treated with E. coli–sgMafb/Maf. Livers were harvested at the indicated time points after bacterial treatment, and representative liver pictures are shown. (L) Liver weights and number of hepatic tumor nodules were measured. n = 3–4 mice for each time point. Representative or pooled data from 2 independent experiments are shown. Data are represented as mean ± SEM. *P < 0.05; **P < 0.01; ***P < 0.001, Student’s t test (B, C, E, F and H); 1-way ANOVA with Tukey’s test in (J).

