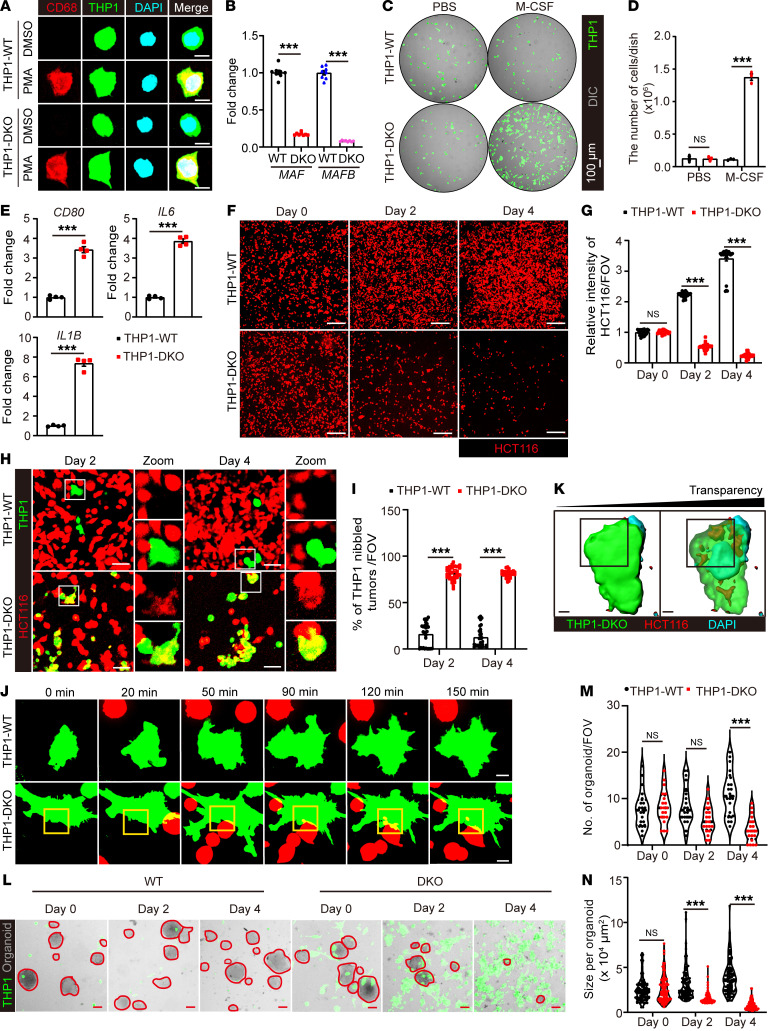
Figure 8. Enhanced antitumor activity of human macrophages by c-Maf/MafB inactivation during M-CSF and bacterial treatment.
Validation of ZsGreen-expressing WT or DKO THP1-derived macrophages by immunofluorescent staining of (A) hCD68, and (B) qPCR detection of MAF and MAFB expression. n = 8 cell samples. Scale bars: 10 μm. (C) Representative images of THP1-WT or DKO macrophages cultured in the absence or presence of human M-CSF for 3 days. (D) Quantification of cell numbers in C. n = 4 cell samples. (E) THP1 macrophages were treated with ClearColi for 8 hours and washed away. Expression of typical human M1 macrophage–associated genes (CD80, IL6, IL1B) was detected at 48 hours. n = 4 cell samples. (F) Representative images of HCT-116-tdTomato cells at days 0, 2, and 4 after coculture with hM-CSF and ClearColi primed THP1-WT or DKO macrophages. Scale bars: 200 μm. (G) HCT-116 cell density per FOV measured by tdTomato fluorescence intensity in F. n = 30 FOVs. (H) Representative images of macrophage and HCT116 tumor cell coculture at the indicated time points. Scale bars: 50 μm. Original magnification, zoomed images: × 2.5. (I) Percentages of macrophages with tumor fragments inside the cells. n = 30 FOVs. (J) Live-cell imaging and (K) 3D reconstitution of macrophage-tumor interactions during coculture. Scale bars: 10 μm. (L) Representative images of macrophages and patient-derived CRC organoid coculture at indicated time points. Scale bars: 100 μm. (M) Number and (N) size of organoids in L were measured. n = 20 FOVs. Representative or pooled data from 2 independent experiments are shown. Data are represented as mean ± SEM. **P < 0.01; ***P < 0.001, 2-way ANOVA with Tukey’s test (B, D, G, I, M and N); Student’s t test in (E).

