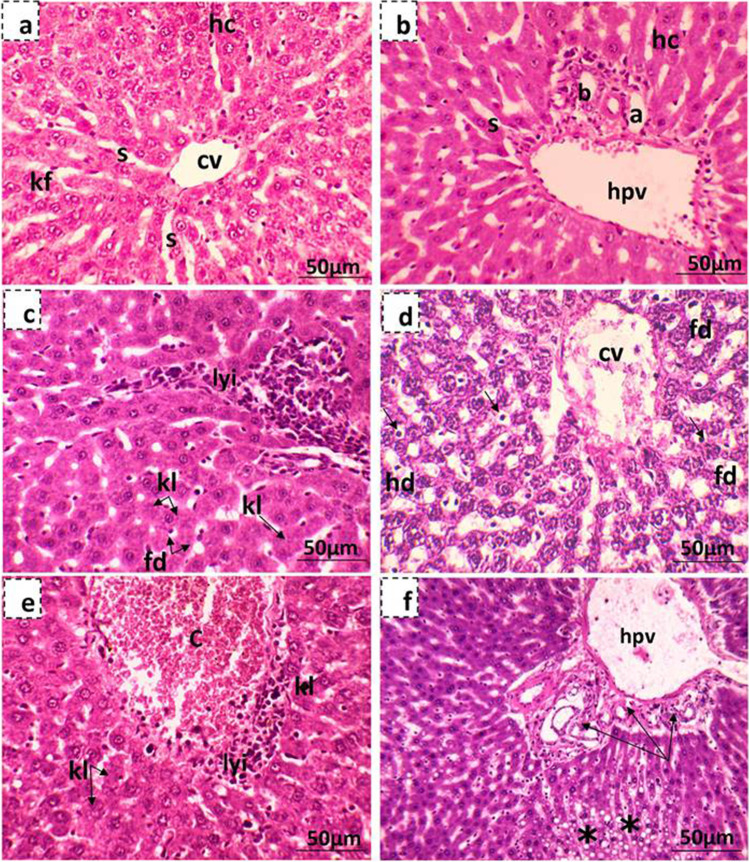
Fig. 10.
Photomicrographs showing liver tissue of the 19th day of gestation mother rats stained with hematoxylin and eosin. a, b Liver tissue of the control mother showing the central and portal areas which contain a branch of the central vein (c), cords of hepatocytes (H), hepatic sinusoids (s), the hepatic portal vein (hpv), branch of the hepatic artery (a), and bile ducts (b). c, d Maternal liver tissue of low-dose MSG-treated group where (c) shows focal lymphocytic infiltration (lyi), fatty degeneration (fd), Karyorrhexis (kh), and karyolysis (kl) of hepatocytes and (d) shows diluted sinusoids and most of the hepatocytes showing hydropic degeneration (hd), fatty degeneration (fd), karyorrhexis (kh), and karyolysis (kl). Some hepatocytes appear with pyknotic nuclei (arrow). e, f Maternal liver tissue of high-dose MSG-treated group where (e) shows congested central vein (c) with lymphatic infiltration (lyi) and a lot of karyolysis (kl) hepatocyte and (f) shows hyperplasia of bile ducts (arrow) with infiltration of inflammatory cells and destruction of the area surrounding the congested portal vein (hpv) and focal fatty degeneration of hepatocytes (star)

