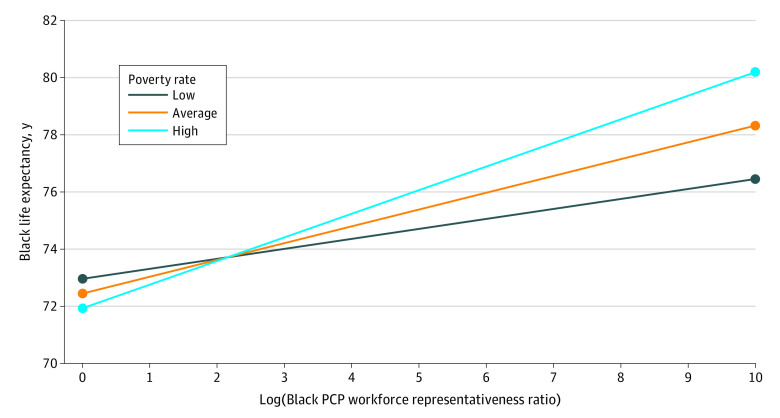
Figure 2. Statistical Moderation Analysis: Plot of 2-Way Interaction Between the Log-Transformed Black Primary Care Physician (PCP) Workforce Representativeness Ratio (Between-County Influence) With Poverty Rates (Between-County Influence).
Estimated values (95% CIs) for the simple slopes at low poverty rates (1 SD below the mean), average poverty rates (0 for mean-centered poverty), and high poverty rates (1 SD above the mean) were 0.34 (0.07 to 0.62), 0.59 (0.39 to 0.79), and 0.83 (0.58 to 1.09), respectively. The simple slopes depicting the association between Black PCP representation and life expectancy were statistically significant at each level of poverty (low, average, and high), yet were greater for counties with high poverty (ie, with the simple slope for high poverty being equal to 0.83) compared with those with low or average poverty levels.65 Further, in terms of percentage increases, these results can be mathematically reformulated to show that a 10% increase in Black PCP workforce representation is associated with an 11.83-day (95% CI, 2.44 to 21.57), 20.53-day (95% CI, 13.57 to 27.48), or 28.87-day (95% CI, 20.18 to 37.92) increase in life expectancy for low, average, and high poverty levels, respectively. This mathematical reformulation is based on standard statistical guidelines for interpreting log-transformed predictors in general linear or linear mixed models.64

