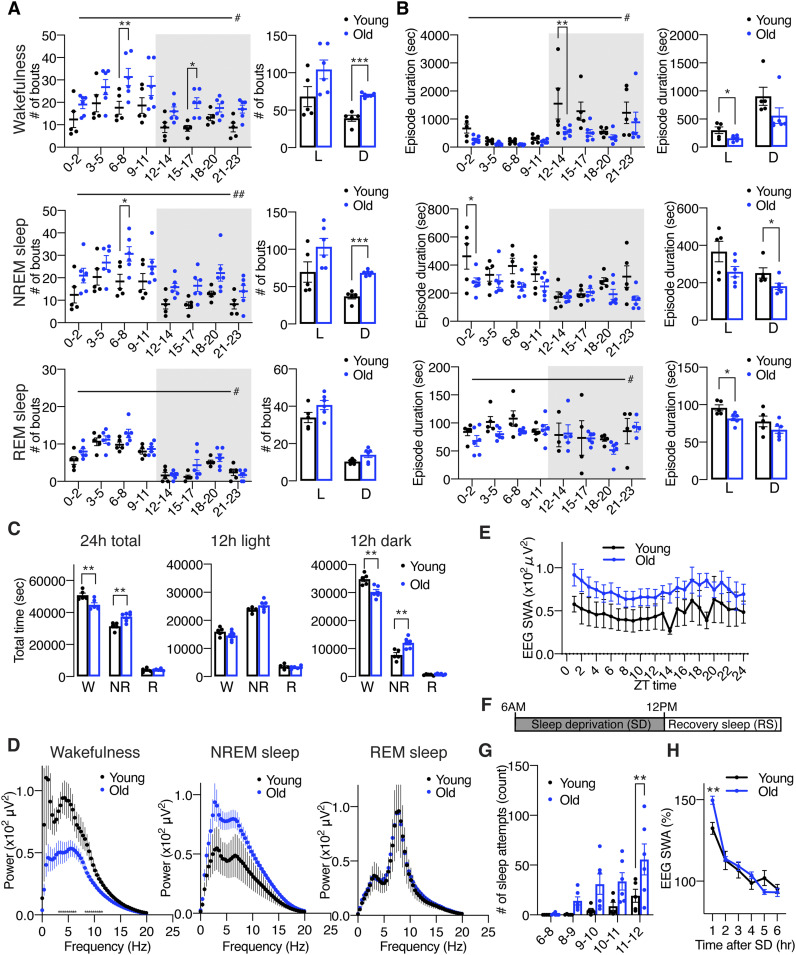
Figure 1. Old C57BL/6J mice display increases in sleep fragmentation, sleep propensity, and excessive sleepiness during SD.
(A, B) Numbers of episodes (A) and duration (B) of wakefulness (top), NREM sleep (middle), and REM sleep (bottom) every 3 h through a day (left) and during the light (L) and dark (D) periods (right) in young and old mice (n = 5–6). Shading indicates dark period. Values are shown as means ± S.E., #P < 0.05 and ##P < 0.01 by repeated measures ANOVA, *P < 0.05, **P < 0.01, and ***P < 0.001 by repeated measures ANOVA with Bonferroni’s post hoc test (left) or unpaired t test (right). (C) Total amount of wakefulness, NREM sleep, and REM sleep during a 24-h period (24 h total), 12-h light period (12 h light) or 12-h dark period (12 h dark) (n = 5–6). Values are shown as means ± S.E., listed P-values, **P < 0.01 by unpaired t test. (D) EEG spectra of wakefulness (left), NREM sleep (middle), and REM sleep (right) during the light period (n = 5–6). Values are shown as means ± S.E. (E) SWA in the range of frequencies between 0.5 and 4 Hz during NREM sleep for a 24-h period (n = 5–6). Values are shown as means ± S.E. *P < 0.01 by unpaired t test. (F) Schematic of SD. Sleep was deprived for 6 h, between 6 am and 12 pm, followed by a period of RS. (G) Number of sleep attempts during SD from 6 am to 8 am (6–8), 8 am to 9 am (8–9), 9 am to 10 am (9–10), 10 am to 11 am (10–11), and 11 am to 12 pm (11–12) in young and old mice (n = 5–6). Values are shown as means ± S.E., **P < 0.01 and by repeated measures ANOVA with Bonferroni’s post hoc test. (H) SWA after SD in young and old mice (n = 5–6). Each value is relative to the average of the 24-h baseline day. Values are shown as means ± S.E., **P < 0.01 by repeated measures ANOVA with Bonferroni’s post hoc test.

