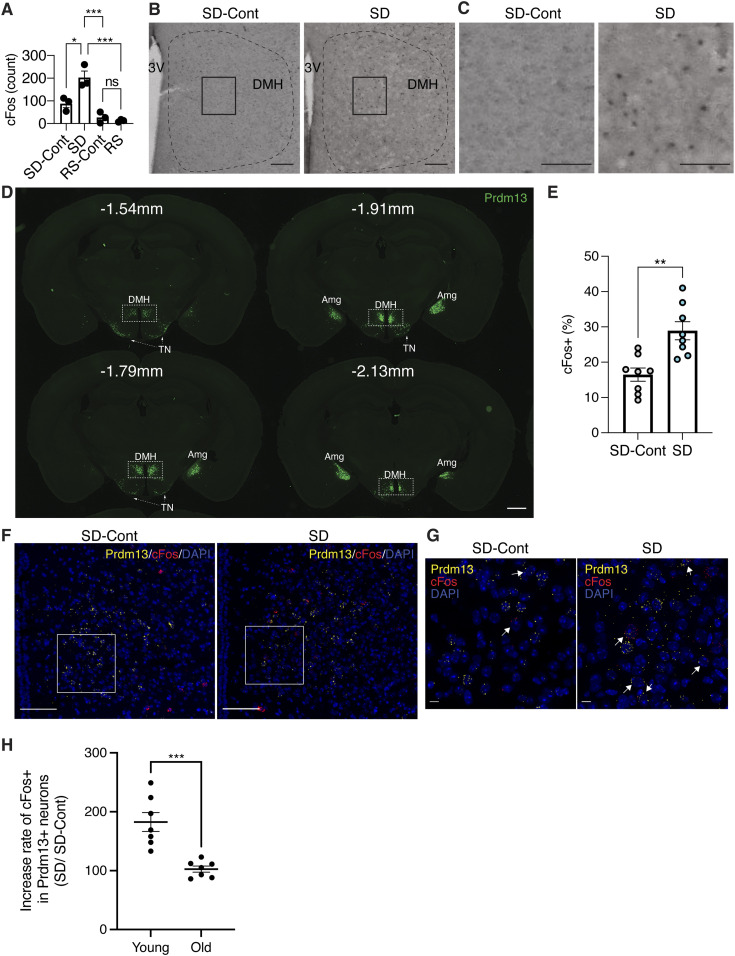
Figure 2. Prdm13+ neurons in the DMH are activated during SD.
(A) Total numbers of cFos+ cells in the DMH during SD, RS, and sleeping control (SD-Cont, RS-Cont) detected by cFos immunohistochemistry. The total number of cFos+ cells in the DMH was counted at bregma −1.67 mm, −1.79 mm, and −1.91 mm and summed up (total three sections) each mouse (n = 3). The third ventricle (3V) is shown. Values are shown as means ± S.E., *P < 0.05, ***P < 0.001, and non-significant (ns) by one-way ANOVA with Bonferroni’s post hoc test. (B, C) Images of DMH sections at bregma −1.67 mm from mice under SD-Cont (left) and SD (right) with cFos. Boxed areas were shown at high magnification in (C). Scale bar indicates 100 and 25 μm (B and C, respectively). (D) Images of the ZsGreen signal (Prdm13, green) including the DMH, amygdala (Amg), and tuberal nucleus (TN) at bregma −1.54, −1.79, −1.91, and −2.13 mm of Prdm13-ZsGreen mice. Scale bar indicates 100 μm. (E) Ratios of cFos+ cells within Prdm13+ cells in young mice during SD and SD-Cont detected by RNAscope in situ hybridization (n = 8). Values are shown as means ± S.E., *P < 0.05 and **P < 0.01 by two-way ANOVA with Bonferroni’s post hoc test. (F, G) Representative images of DMH sections from young mice under SD-Cont (left) and SD (right) with Prdm13 (yellow) and cFos (red) visualized by RNAscope. Boxed areas were shown at high magnification in (G). Cells were counterstained with DAPI (blue). Scale bars indicate 100 and 10 μm (F and G, respectively). (H) Ratios of cFos+ cells within Prdm13+ cells under SD relative to SD-Cont in young and old mice (n = 7–8). Values are shown as means ± S.E., ***P < 0.001 by two-way ANOVA with Bonferroni’s post hoc test.

