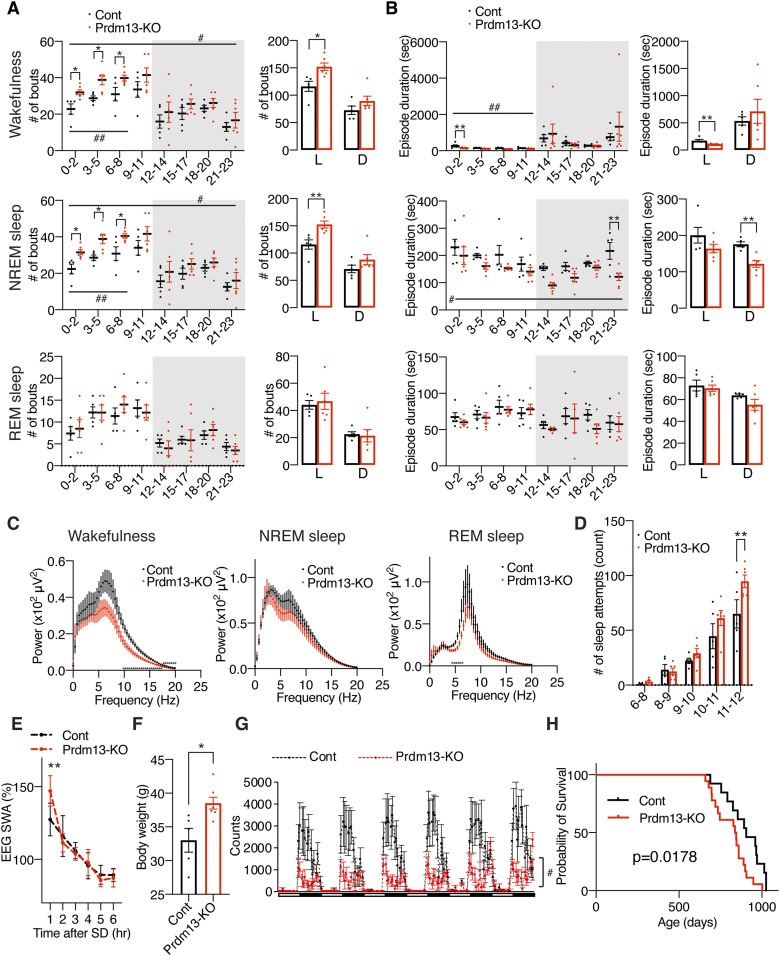
Figure 5. Old DMH-Prdm13-KO mice display age-associated pathophysiology and shortened lifespan.
(A, B) Numbers of episodes (A) and duration (B) of wakefulness (top), NREM sleep (middle), and REM sleep (bottom) every 3 h through a day (left) and during the light (L) and dark (D) periods (right) in old DMH-specific Prdm13-knockout (Prdm13-KO) and control (Cont) mice (n = 5–6). Values are shown as means ± S.E., #P < 0.05 and ##P < 0.01 by repeated measures ANOVA, *P < 0.05 and **P < 0.01 by repeated measures ANOVA with Bonferroni’s post hoc test (left) or unpaired t test (right). (C) EEG spectra of wakefulness (left), NREM sleep (middle), and REM sleep (right) during the light period (n = 4–6). Values are shown as means ± S.E., *P < 0.01 by unpaired t test. (D) Number of sleep attempts during SD from 6 am to 8 am (6–8), 8 am to 9 am (8–9), 9 am to 10 am (9–10), 10 am to 11 am (10–11), and 11 am to 12 pm (11–12) in old Prdm13-KO and Cont mice (n = 5–6). Values are shown as means ± S.E., **P < 0.01 by repeated measures ANOVA with Bonferroni’s post hoc test. (E) SWA after SD of Prdm13-KO and Cont mice at 20 mo of age. Normalized power is relative to the average of the 24-h baseline day (n = 5–6). Values are shown as means ± S.E., **P < 0.01 by Bonferroni’s post hoc test. (F) Body weight of old Prdm13-KO and Cont mice (n = 5–7). Values are shown as means ± S.E., *P < 0.05 by unpaired t test. (G) The level of wheel-running activity in old Prdm13-KO and Cont mice for six consecutive days (n = 5–7). Values are shown as means ± S.E., #P < 0.05 by repeated measures ANOVA. (H) Kaplan–Meier curves of Prdm13-KO and Cont mice (n = 13–18). Listed P-value was calculated by log-rank test.

