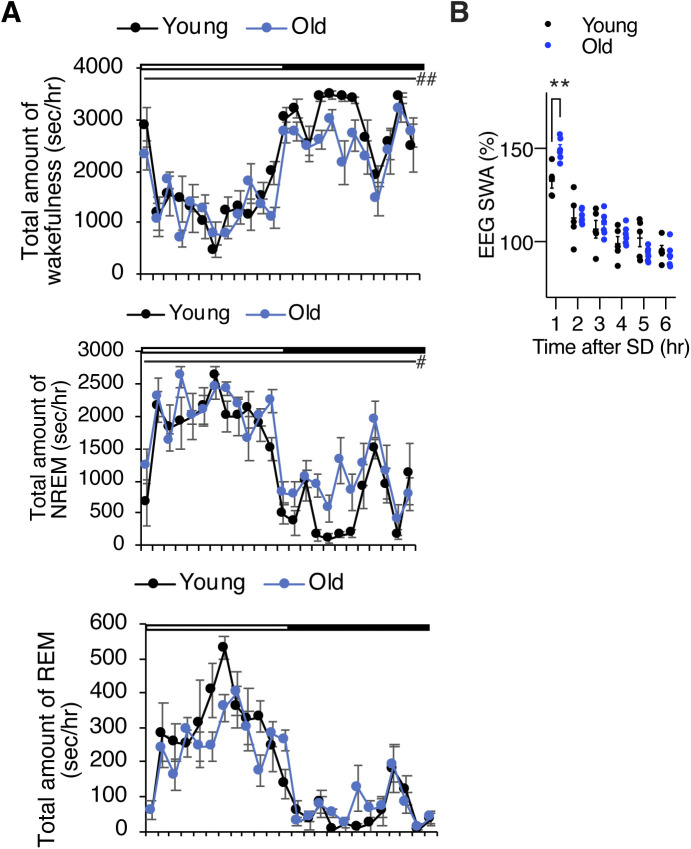
Figure S1. Old C57BL/6J mice display increased sleep propensity and increased SWS after SD.
(A) Total amount of wakefulness (top), NREM sleep (middle), and REM sleep (bottom) in young and old mice. Open bar indicates the light period and filled bar indicates the dark period (n = 5–6). Values are shown as means ± S.E., #P < 0.05, ##P < 0.01 by repeated measures ANOVA. (B) SWA after SD. Each value is relative to the average of the 24-h baseline day. Values are shown as means ± S.E., **P < 0.01, by repeated measures ANOVA with Bonferroni’s post hoc test.

