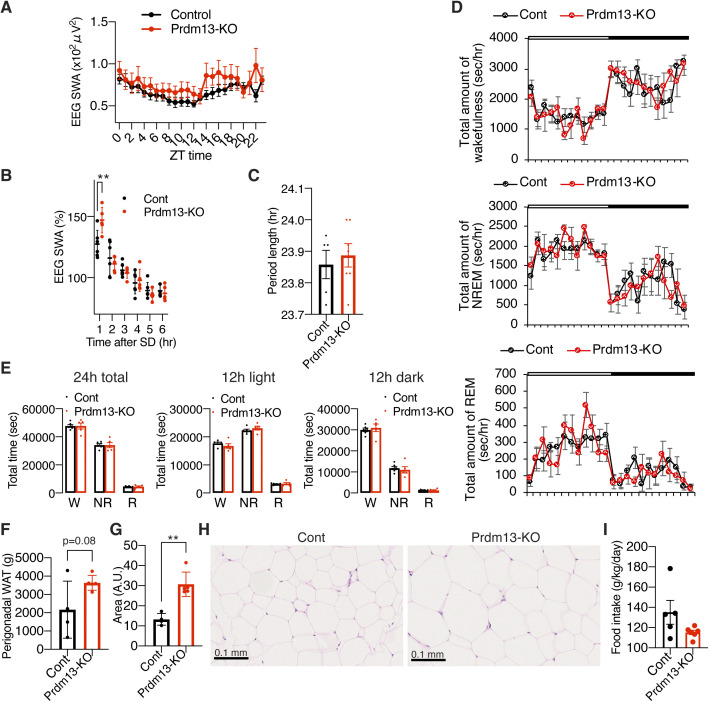
Figure S5. Old DMH-specific Prdm13-knockout mice display high SWA after SD, no abnormality in the amount of sleep/wakefulness but increased adipose tissue.
(A) SWA in the range of frequencies between 0.5 and 4 Hz during NREM sleep for a 24-h period (n = 5–6) in old DMH-specific Prdm13-knockout (Prdm13-KO) and control (Cont) mice. Normalized power is relative to the average of the 24-h baseline day each group. Values are shown as means ± S.E. (B) SWA after SD. Normalized power is relative to the average of the 24-h baseline day. Values are shown as means ± S.E. (C) Period length of old Prdm13-KO and Cont mice (n = 5–7). Values are shown as means ± S.E. (D) Total amount of wakefulness (top), NREM sleep (middle), and REM sleep (bottom) in old Prdm13-KO and Cont mice. Open bar indicates light period, and filled bar indicates dark period (n = 5–6). Values are shown as means ± S.E. (E) Total amount of wakefulness (W), NREM sleep (NR), and REM sleep (R) during a 24-h period (24 h total), 12-h light period (12 h light), or 12-h dark period (12 h dark) (n = 5–6). Values are shown as means ± S.E. (F) Weight of the perigonadal WAT in old Prdm13-KO and Cont mice. Values are shown as means ± S.E., listed P-value was calculated by unpaired t test. (G, H) Size of adipocytes in the perigonadal WAT in old Prdm13-KO and Cont mice (n = 4–5, average of five randomly selected areas). Values are shown as means ± S.E., **P < 0.01 by unpaired t test. Representative images are shown in (H). Scale bar indicates 0.1 mm. (I) Food intake of old Prdm13-KO and Cont mice (n = 5–6). Values are shown as means ± S.E.

