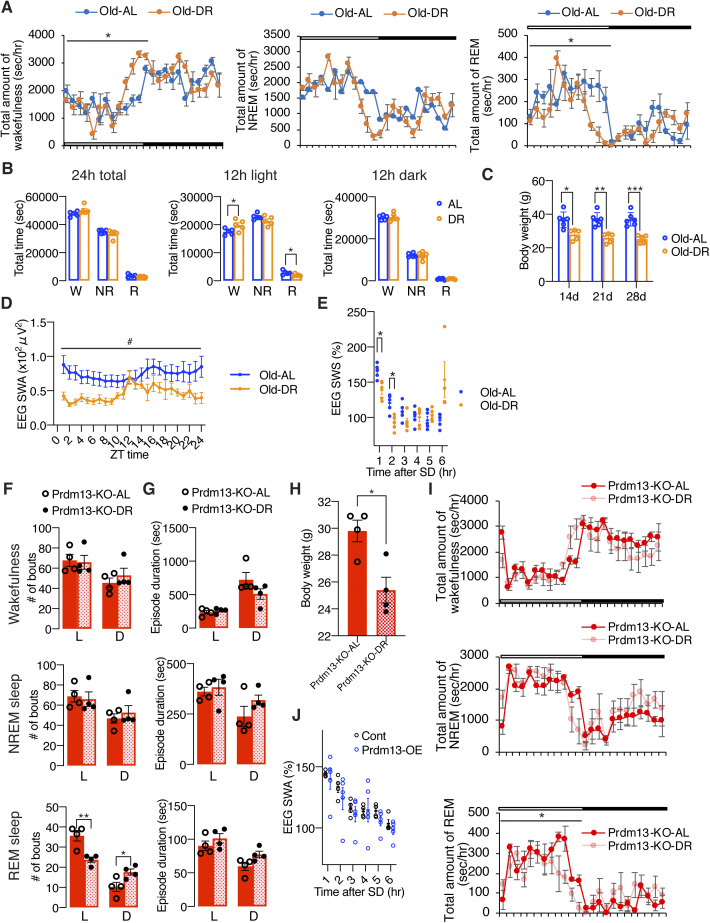
Figure S6. Diet restriction and overexpression of Prdm13 in the DMH ameliorates excessive sleepiness during SD in old mice.
(A) Total amount of wakefulness (left), NREM sleep (middle), and REM sleep (right) in old diet-restricted (Old DR) and old ad libitum (Old AL) mice (n = 5). Open bar indicates light period and filled bar indicates dark period. Values are shown as means ± S.E., *P < 0.05 by repeated measures ANOVA. (B) Total amount of wakefulness, NREM sleep, and REM sleep during a 24-h period (24 h total), 12-h light period (12 h light) or 12-h dark period (12 h dark) (n = 5). Values are shown as means ± S.E., *P < 0.05 by unpaired t test. (C) Body weight of Old DR and Old AL mice for 14, 21, and 28 d (n = 5–6). Values are shown as means ± S.E., *P < 0.05, **P < 0.01, and ***P < 0.001 by repeated measures ANOVA with Bonferroni’s post hoc test. (D) SWA after SD of Old AL and Old DR mice. Normalized power is relative to the average of the 24-h baseline day (n = 5). Values are shown as means ± S.E., *P < 0.01 by Bonferroni’s post hoc test. (E) SWA during NREM sleep for a 24-h period. Normalized power is relative to the average of the 24-h baseline day (n = 5–6). Values are shown as means ± S.E., #P < 0.05 by repeated measures ANOVA. (F, G) Numbers of episode (F) and duration (G) of wakefulness (top), NREM sleep (middle), and REM sleep (bottom) during the light (L) and dark (D) periods in AL and DR of DMH-specific Prdm13-knockout (Prdm13-KO-AL and Prdm13-KO-DR, respectively) mice (n = 4). Values are shown as means ± S.E., *P < 0.05 and **P < 0.01 by unpaired t test. (H) Body weight of Prdm13-KO-AL and Prdm13-KO-DR mice (n = 4). Values are shown as means ± S.E., *P < 0.05 by unpaired t test. (I) Total amount of wakefulness (top), NREM sleep (middle), and REM sleep (bottom) in Prdm13-KO-AL and Prdm13-KO-DR mice (n = 4). Open bar indicates light period and filled bar indicates dark period. Values are shown as means ± S.E., *P < 0.05 by repeated measures ANOVA. (J) SWA after SD of Prdm13-OE and control (Cont) mice. Normalized power is relative to the average of the 24-h baseline day (n = 4). Values are shown as means ± S.E.

