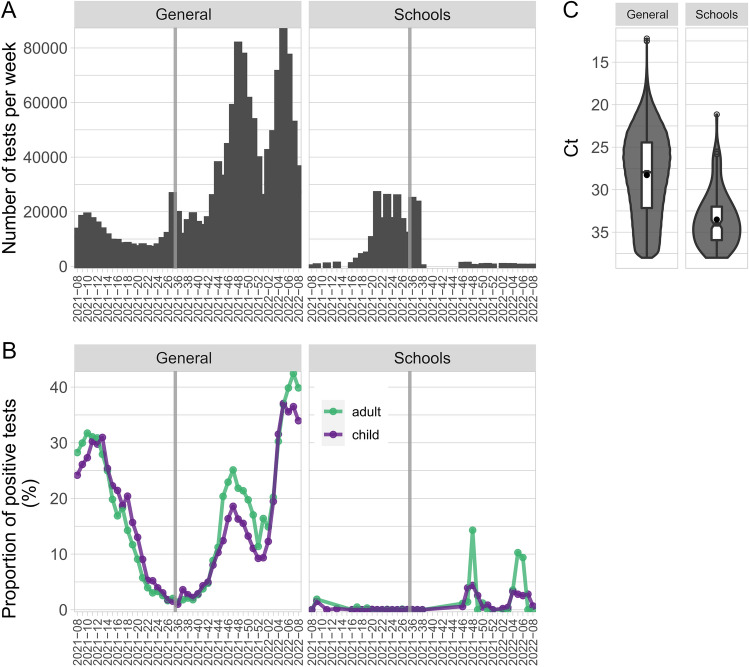
Figure 4.
Comparison of general and school testing. (A) The total number of general and school tests that were performed between weeks 2021-08 and 2022-08. (B) Proportion of positive general and school tests (%). The age of 19 years was used as the threshold between the group of children and adults. (C) Ct distributions of positive general and school tests shown as violin plots, supplemented with mean Ct values (black points) and notched boxplots.

