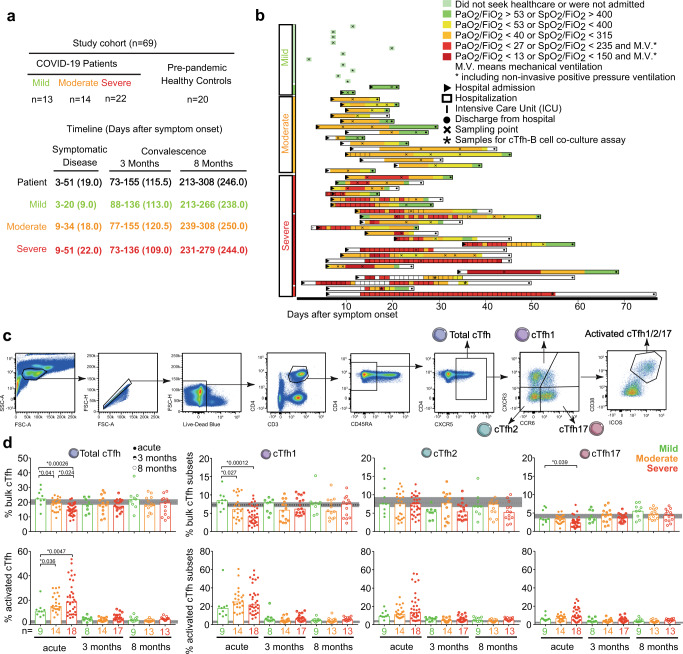
Fig. 1. Longitudinal frequency and activation of cTfh cells in COVID-19 patients across disease severity from acute disease up to 8 months convalescence.
a Overview of study cohort (n = 69), and b the timeline of longitudinal sampling. Patients are grouped based on peak disease severity, including mild (green), moderate (orange) and severe (red). Individual patients are color-coded based on daily disease severity. PaO2 is expressed in kPa. c Gating strategy to identify cTfh cells in PBMCs by flow cytometry. From single, live CD3+ CD4+ T cells, memory CD4+ T cells were identified as CD45RA−. From memory CD4+ T cells, cTfh cells were identified as CXCR5+ cells. cTfh subsets were identified as cTfh1 (CXCR3+ CCR6−), cTfh2 (CXCR3− CCR6−) and cTfh17 (CXCR3- CCR6+). Activated cTfh and its subsets were identified with ICOS+ CD38+ expressing. Patients are grouped based on peak disease severity, including mild (green), moderate (orange) and severe (red). d Bar charts show the frequency of bulk and activated cTfh, cTfh1, cTfh2, and cTfh17 cells from COVID-19 patients with acute disease (Acute, full circle), 3 months convalescence (3 months, half circle) and 8 months convalescence (8 months, open circle) with median. Dots are individual samples color-coded according to peak disease severity. Dotted lines show the median frequency with 95% Cl (gray area) of prepandemic healthy controls. X axis shows the number of patients in each bar. During acute disease, 9, 22, and 33 individual samples from 9 mild, 14 moderate and 18 severe patients, respectively, were analyzed using two-sided Generalized Estimating Equations (GEE) to account for the intra-person correlations inherent to repeated measures and assess statistically significant differences without adjusting for multiple comparisons. During 3 and 8 months convalescence, only one sample from each patient was analyzed and two-sided Kruskal–Wallis with Dunn’s multiple comparisons test was used to assess statistically significant differences. P < 0.05 was considered to be a significant difference. *P values <0.05 are listed above each comparison. Source data are provided as a Source Data file.

