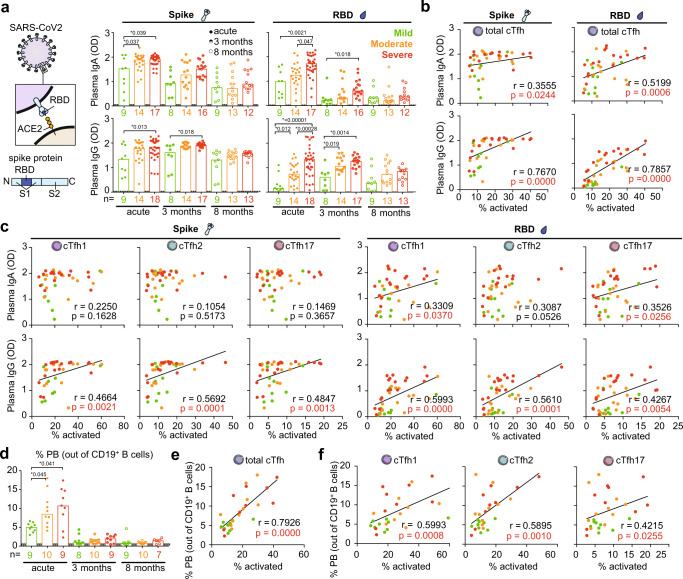
Fig. 2. Longitudinal titers of plasma immunoglobulins against SARS-CoV-2 spike and RBD and frequency of blood plasmablast (PB) in COVID-19 patients across disease severity from acute disease up to 8 months convalescence.
a Bar charts show the OD value of plasma IgA and IgG against SARS-CoV-2 spike and RBD with median. During acute infection (full circle), 9, 22, and 33 individual samples from 9 mild, 14 moderate, and 18 severe patients, respectively, were analyzed using two-sided Generalized Estimating Equations (GEE) to account for the intra-person correlations inherent to repeated measures and assess statistically significant differences without adjusting for multiple comparisons. During convalescence (half and open circle), only one sample from each patient was analyzed and two-sided Kruskal–Wallis with Dunn’s multiple comparisons test was used to assess statistically significant differences. One severe patient displayed IgA deficiency over time was excluded in all IgA analyses. b, c Two-sided Spearman correlation for plasma immunoglobulins against the spike and RBD versus frequency of activated (b) cTfh and c cTfh subsets during acute disease. In all, 9, 14, and 18 individual samples from 9 mild, 14 moderate and 18 severe patients were analyzed. For patients with longitudinal acute samples, data from the earliest sample was involved as the representative in Spearman correlation analysis. d Frequency of plasmablast from COVID-19 patients is shown by bar chats with median, and the dotted lines show the median frequency with 95% Cl (gray area) of healthy controls. Dots are individual samples color-coded according to peak disease severity. X axis shows the number of patients in each bar. Only one sample from each patient was analyzed during both acute disease and convalescence. Two-sided Kruskal–Wallis with Dunn’s multiple comparisons test was used to consider all statistically significant. e, f Two-sided Spearman correlation for frequency of plasmablast versus frequency of (e) activated cTfh and f activated cTfh subsets during acute disease. Overall, 9, 10, and 9 individual samples from 9 mild, 10 moderate and 9 severe patients were analyzed during acute disease. P < 0.05 was considered to be a significant difference. *P values <0.05 are listed above each comparison. Source data are provided as a Source Data file.

