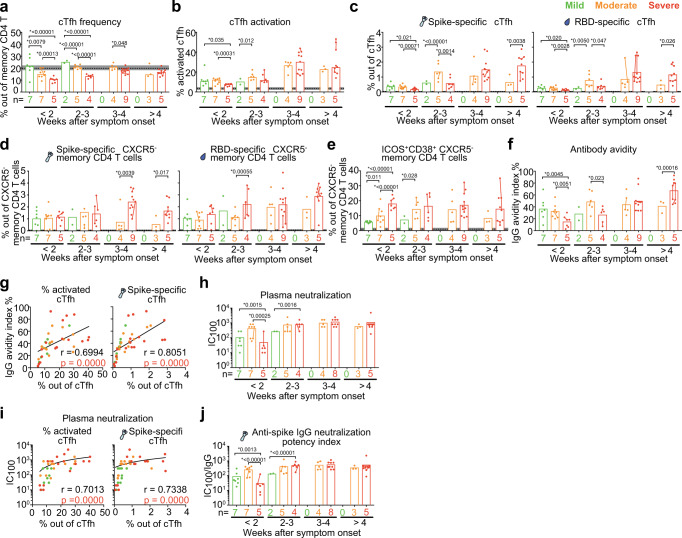
Fig. 5. Delayed emergence of activated and virus-specific cTfh cells correlated with delayed emergence of high avidity and neutralization plasma antibodies in severe COVID-19 patients compared to mild and moderate patients.
a–e Bar charts show the mean frequency of (a) cTfh cells, (b) activated cTfh cells, SARS-CoV-2 spike, and RBD-specific (c) cTfh and (d) CXCR5- memory CD4 T cells, (e) activated CXCR5- memory CD4 T cells in patients with acute COVID-19 according to weeks after symptom onset. f Bar charts show the avidity index of plasma IgG during acute disease against SARS-CoV-2 spike over weeks after symptom onset with mean. g Two-sided Spearman correlation for frequency of activated and virus-specific cTfh versus avidity index of plasma IgG during acute disease. a–g In total, 9, 22, and 33 individual samples from 9 mild, 14 moderate, and 18 severe patients, respectively, were analyzed. h, j Bar charts show the (h) neutralization IC100 and j anti-spike IgG neutralization potency index of COVID-19 patient plasma samples across peak disease severity over weeks after symptom onset. i Two-sided Spearman correlation for frequency of activated and virus-specific cTfh versus plasma neutralization IC100 during acute disease. h–j Overall, 9, 22, and 31 individual samples from 9 mild, 14 moderate, and 17 severe patients, respectively, were analyzed. Dots are individual samples color-coded according to peak disease severity. The dotted lines show the mean frequency with 95% Cl (gray area) of healthy controls. X axis shows number of patients in each bar. Dots from same patient are linked with line in each bar. The graphical presentations of the different outcomes in (a–f, h, j) were based on a two-sided Generalized Estimating Equations model with time modeled using a restricted cubic spline with knots at 0, 14, 21, 28, and 53 days, without adjusting for multiple comparisons. g, i One individual sample from each patient was analyzed for Two-sided Spearman correlation during acute disease. For patients with longitudinal acute samples, data from the earliest sample was involved. P < 0.05 was considered to be a significant difference. *P values <0.05 are listed above each comparison. Source data are provided as a Source Data file.

