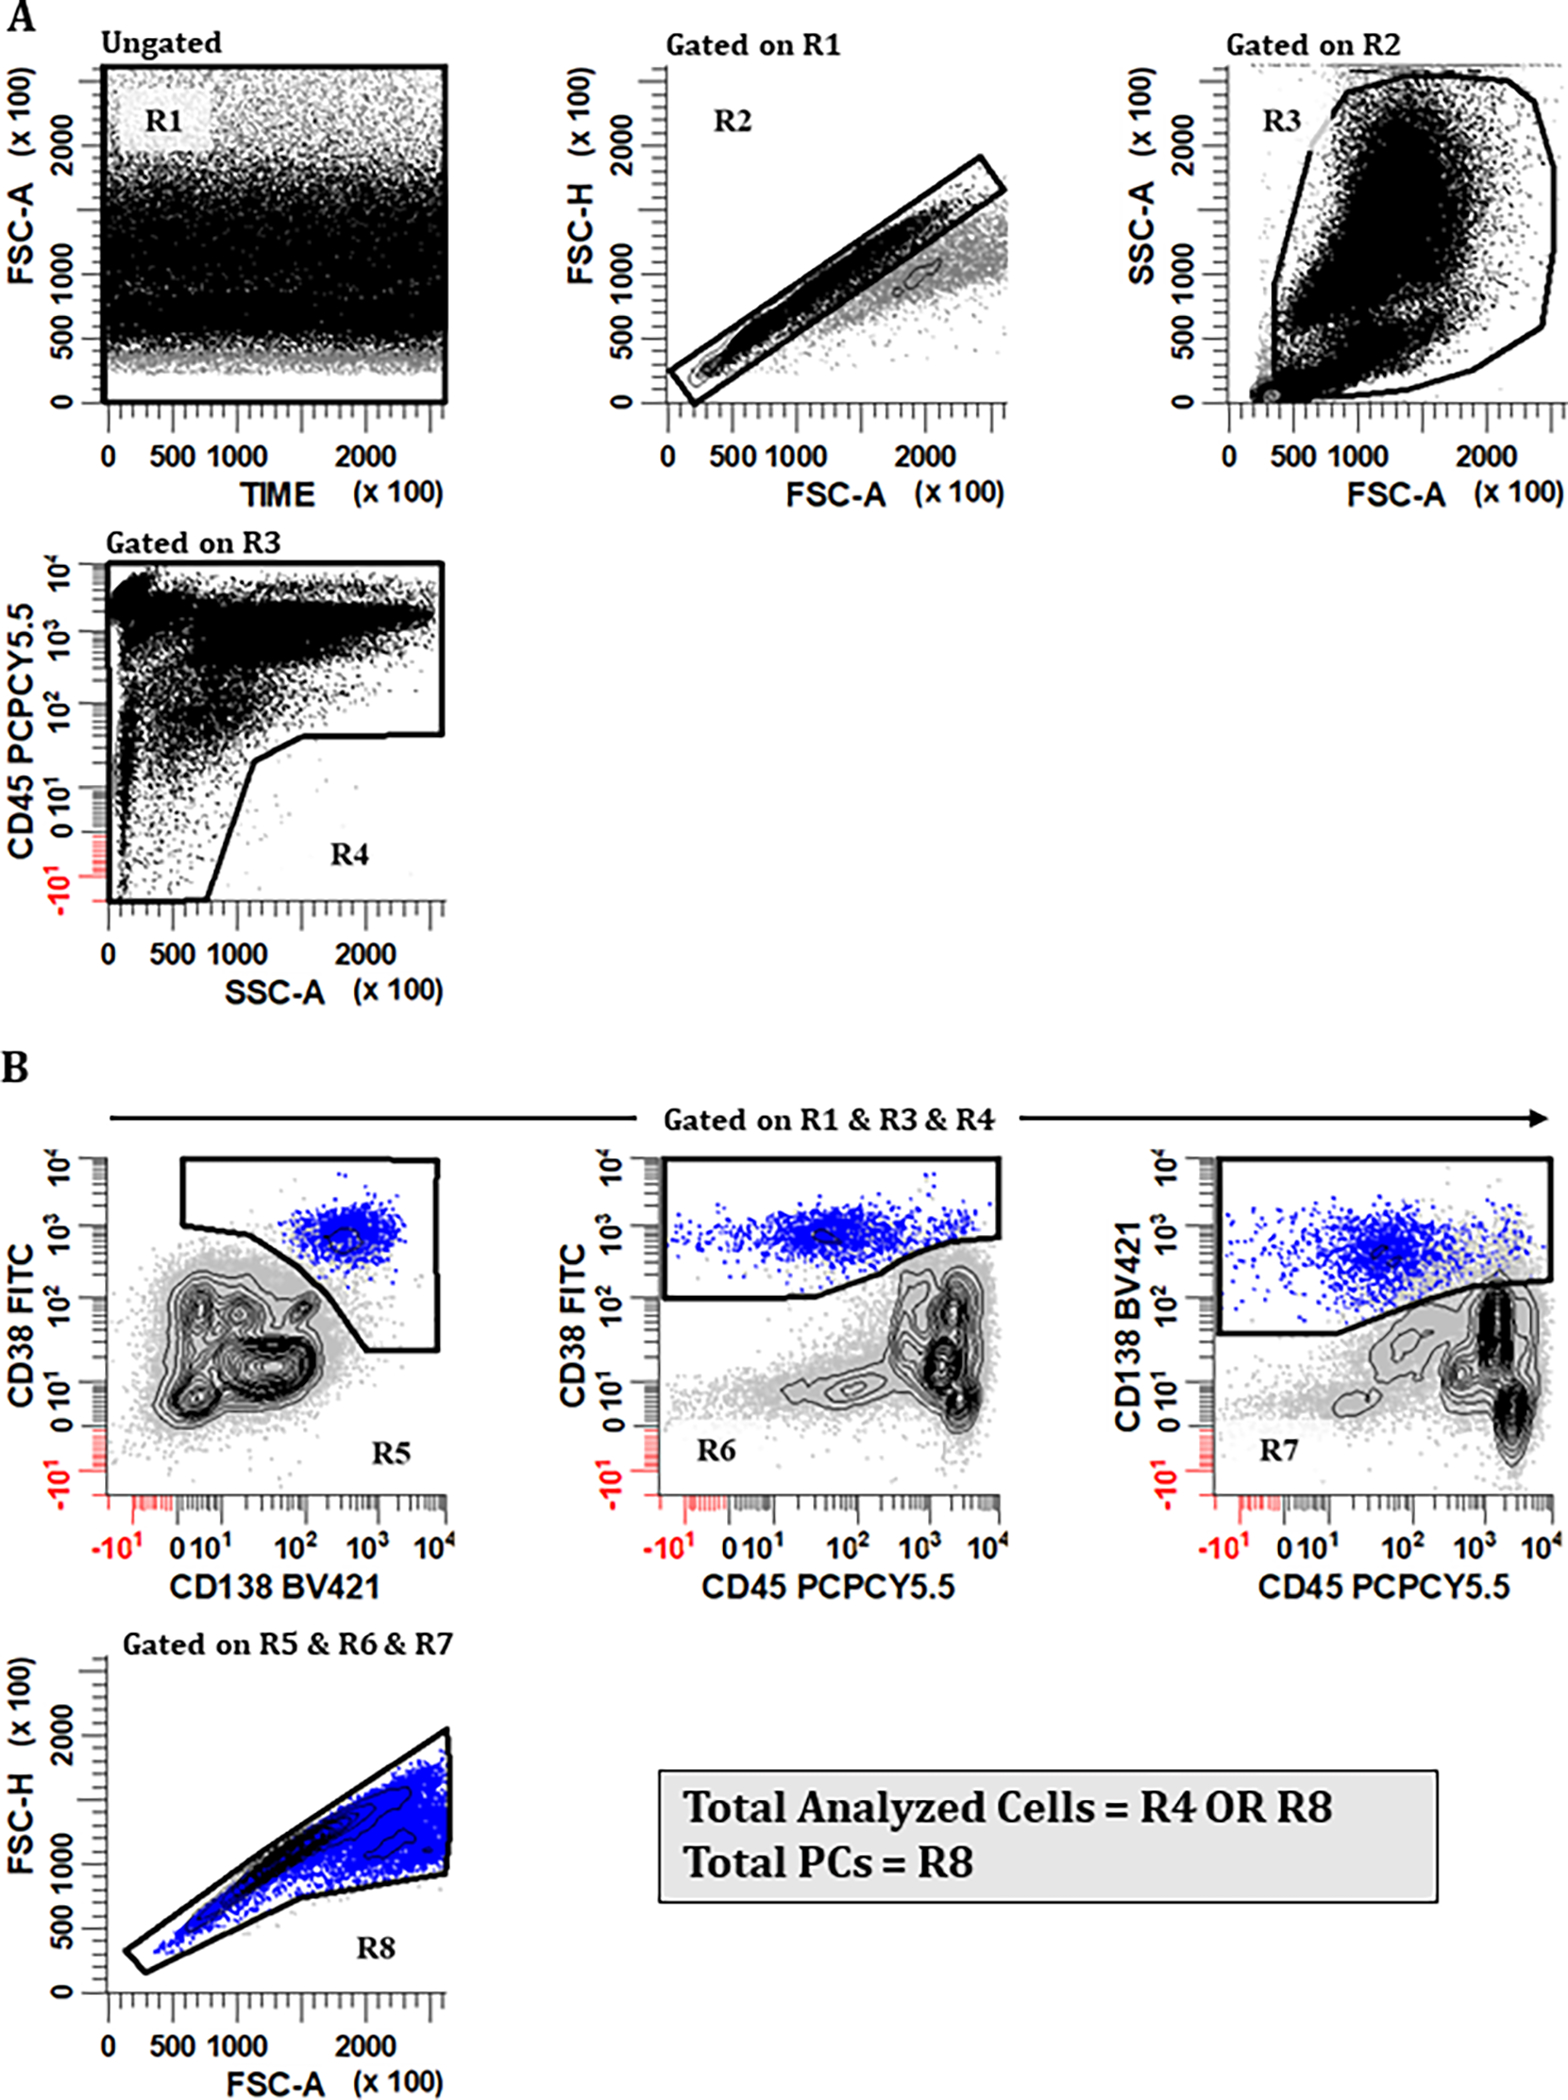
Figure 2. Consensus gating strategy for (A) ‘Total Analyzed Cells’ and (B) ‘Total PCs’.

A harmonized gating approach that can be used for calculating the ‘Total Number of Analyzed Cells’ is important because it is the denominator used in all calculations of population frequencies. (A) Valid events that are singlets and free of large cell aggregates/debris are first identified using a combination of regions. To accomplish this, a region (R1) is created on a bivariate plot of Time vs FSC-A. A rectangular region (R2) is drawn on a bivariate plot of FSC-A vs. FSC-H gated on (R1) to identify singlet events. An irregular region (R3) is then placed on a bivariate plot of FSC-A vs. SSC-A gated on (R1) & (R2) to circumscribe cellular events that are not debris, apoptotic, or large aggregates. A region (R4) is drawn on a plot of SSC-A vs CD45 gated on (R1) & (R2) & (R3) to include CD45+ leukocytes, CD45− erythroid precursors, and CD45-/dim aberrant PCs. (B) For the identification of ‘Total PCs’, a combination of (R1) & (R3) & (R4) is initially used (R2 is intentionally omitted from this Boolean product). On bivariate plots of CD138 vs. CD38, CD45 vs. CD38, and CD45 vs. CD138 all gated on (R1) & (R3) & (R4), regions (R5), (R6), and (R7) are drawn, respectively, to circumscribe PCs expressing CD38br, CD138+, and CD45+/−. Events that satisfy the Boolean product (R5) & (R6) & (R7) are then displayed on a bivariate plot of FSC-A vs. FSC-H. and an irregular region (R8) is drawn to identify ‘Total PCs’, taking precaution to exclude events that are off scale based on FSC-A and SSC-A, which are considered to be true doublets. The final denominator value ‘Total Analyzed Cells’ is therefore represented by the formula (R1) & (R2) & (R3) & (R4) OR (R1) & (R3) & (R4) & (R5) & (R6) & (R7), summarized as (R4) OR (R8), which allows for the inclusion of unusually large and hyperdiploid PCs that fall outside of (R2). All plots were generated using WinList v9.1 (Verity Software House).
