
Figure 3. Consensus gating strategy for defining ‘Abnormal PCs’ using (A) Tube 1 and (B) Tube 2.
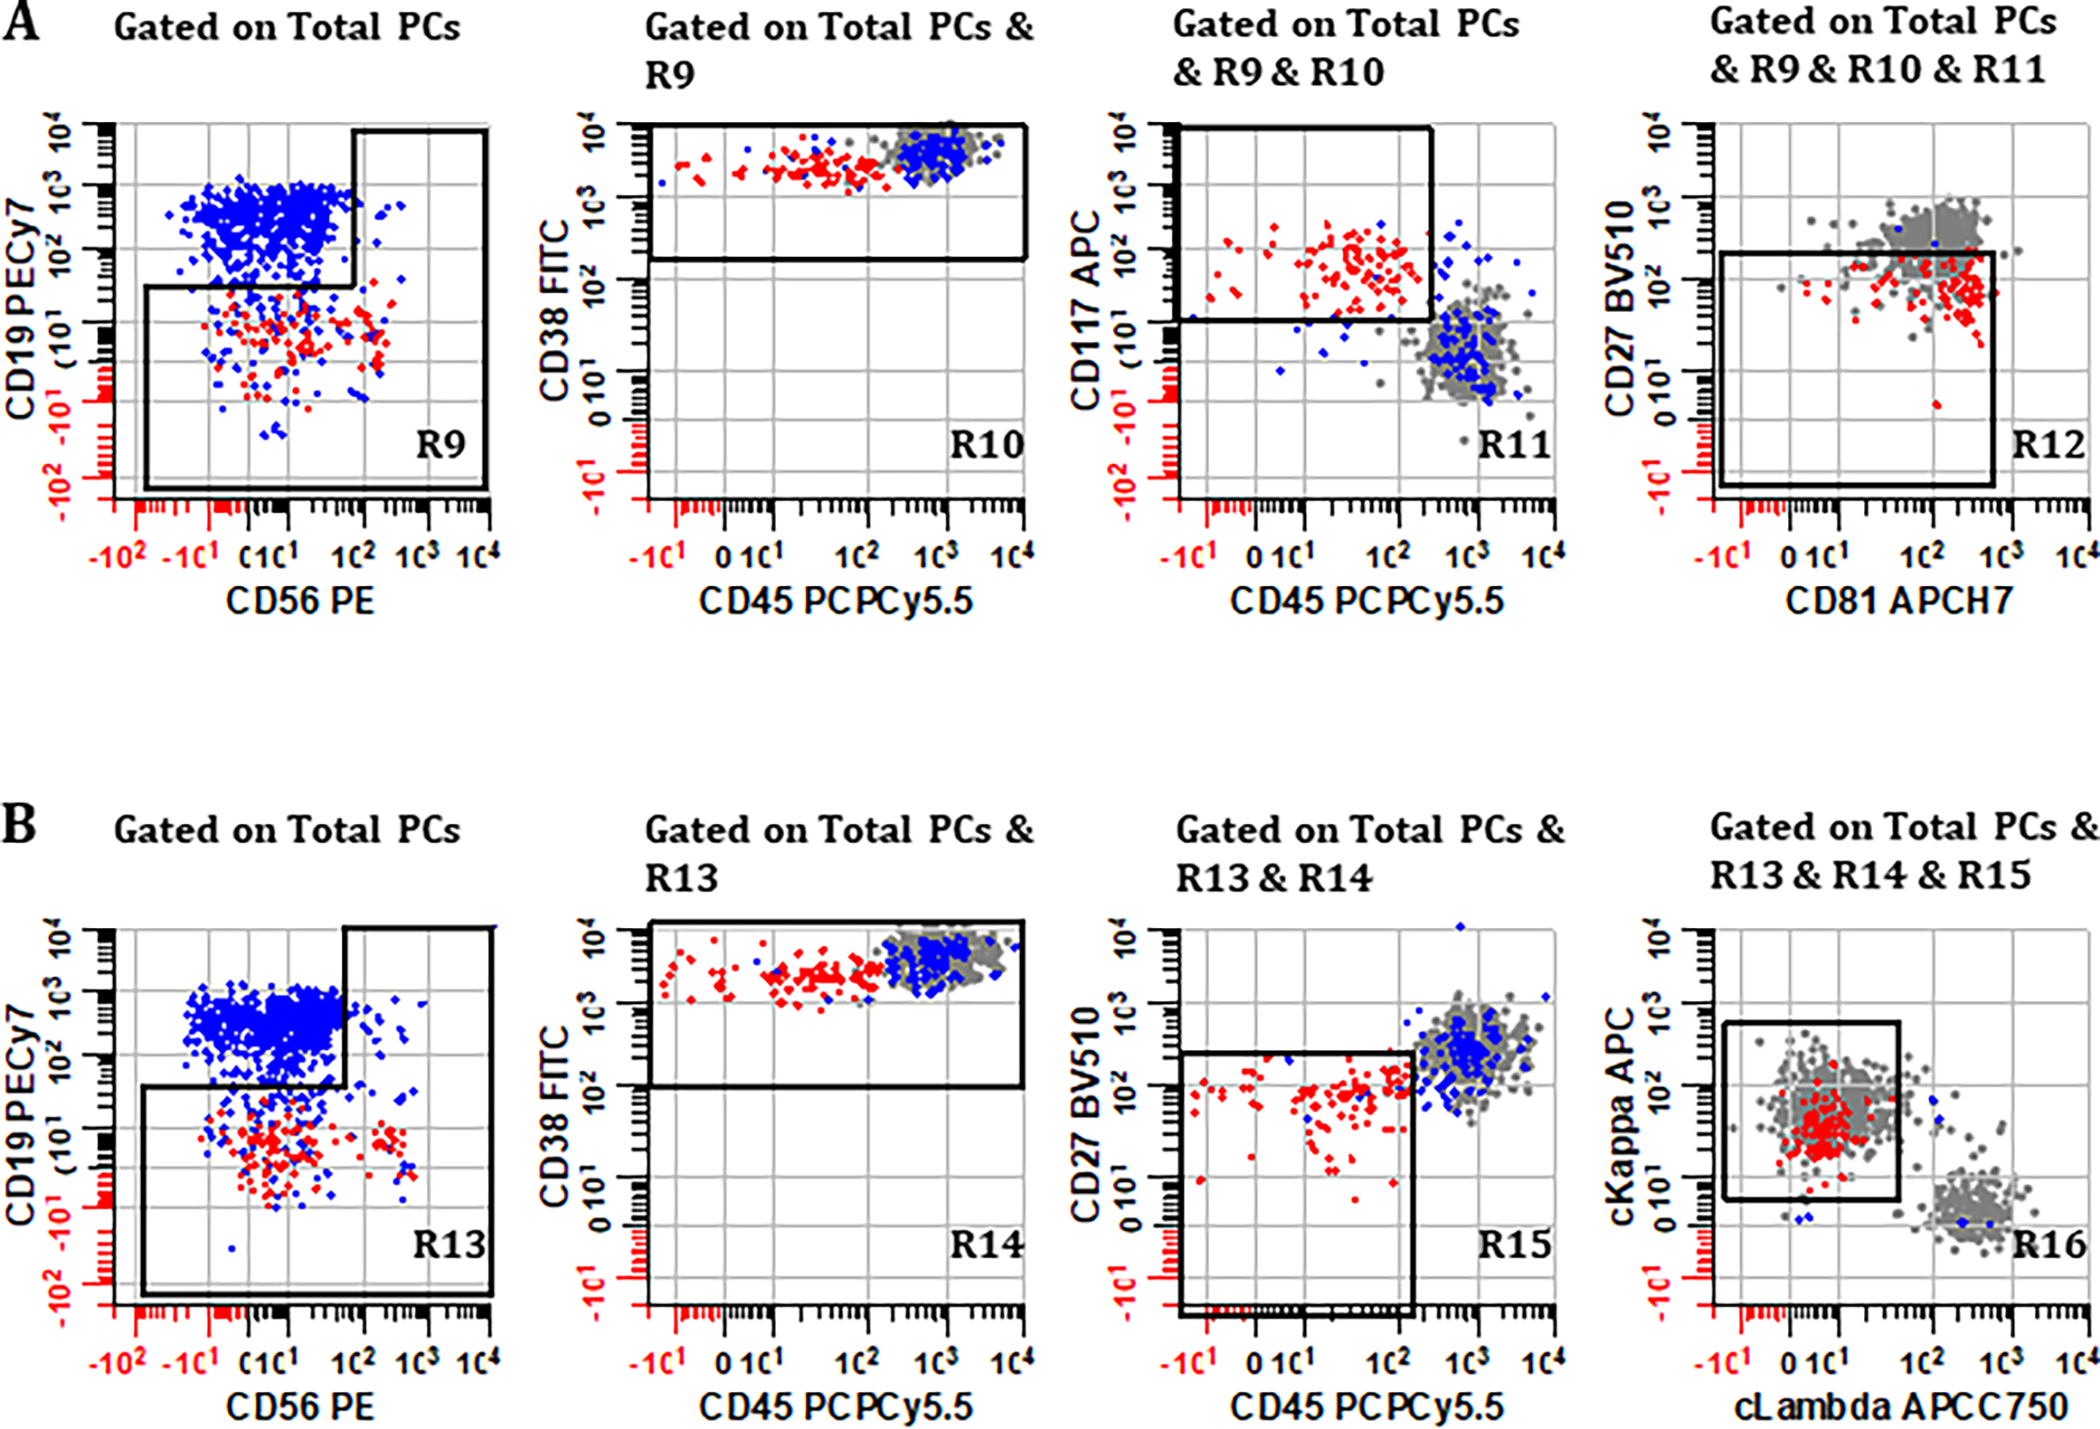
Normal PCs (blue events) typically express CD19+, CD27+, CD38br, CD45+, CD56−, CD81+, CD117−, and polytypic cytoplasmic light chains, whereas abnormal PCs (red events) usually show aberrant expression of two or more markers with demonstrable monotypic light chain expression. Gray events represent population of normal PCs that will be discarded during the sequential gating procedure; the gray events are only displayed here for illustration purposes. Using one of the cases as an example, (A) plots derived from Tube 1 gated on ‘Total PCs’ (R8) show how abnormal PCs are defined by sequentially gating on regions (R9), (R10), (R11), and (R12) created on bivariate plots of CD56 vs. CD19, CD45 vs. CD38, CD45 vs. CD117, and CD81 vs. CD27, respectively. These regions are drawn generously enough to target known deviations in normal antigen expression on PCs without inadvertently excluding abnormal events, particularly if no demarcation between normal and abnormal PC is evident on a specific bivariate plot. (B) Using plots derived from Tube 2, the sequential gating algorithm is repeated, this time focusing additionally on light chain expression of events that satisfy the Boolean product of regions (R13) & (R14) & (R15) & (R16) drawn on bivariate plots CD56 vs. CD19, CD45 vs. CD38, CD45 vs. CD27, and cLambda vs. cKappa, respectively. All plots were generated using WinList v9.1 (Verity Software House).