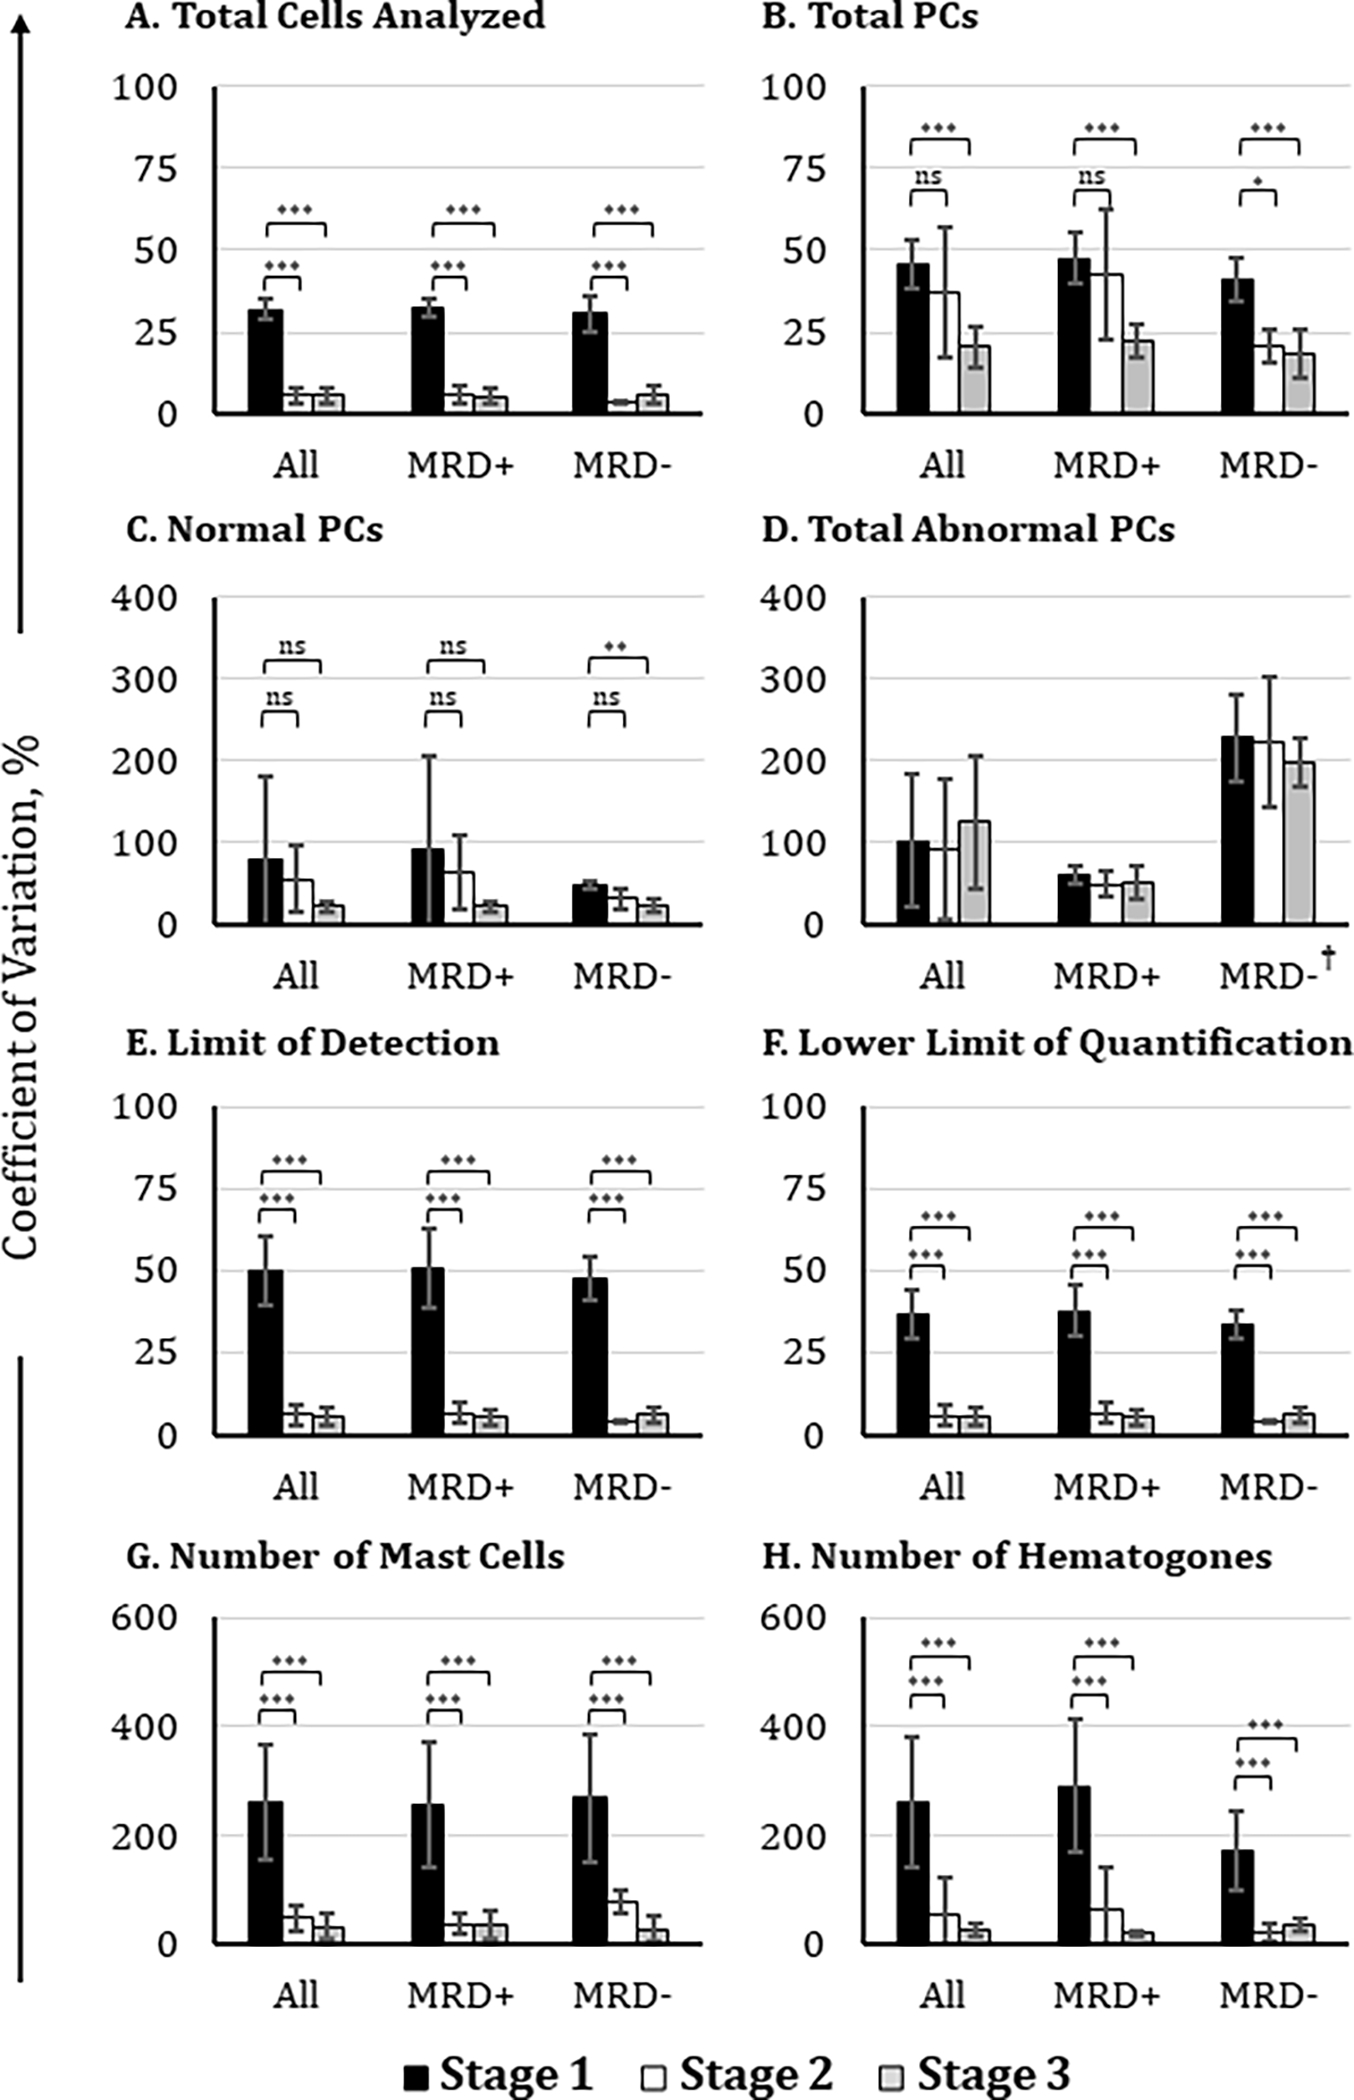
Figure 4. Comparison of participants’ agreement on MRD status before and after adoption of a consensus analysis protocol.

Participating institutions (n = 17) analyzed FCS data files of suspected MM MRD samples using their own laboratory-established protocol (black histograms), draft consensus analysis protocol (white histograms), and final consensus analysis protocol (gray histograms). Coefficients of variation were compared for the reported values of (A) total cells analyzed, (B) total PCs, (C) total normal PCs, (D) total abnormal PCs, (E) the limit of detection, (F) the lower limit of quantification, (G) mast cells, and (H) hematogones. The final coefficient of variation values shown here excluded outliers from the data set, which were defined as values greater than 2 standard deviations from the mean. *: p-value < 0.05; **: p-value < 0.01; ***: p-value < 0.001. †: high CV% observed because of the extremely low number of aPCs detected in MRD− samples
